
Abstract
The exposure-dose-response characterization of an inhalation hazard established in an animal species needs to be translated to an equivalent characterization in humans relative to comparable doses or exposure scenarios. Here, the first geometry model of the conducting airways for rhesus monkeys is developed based upon CT images of the conducting airways of a 6-month-old male, rhesus monkey. An algorithm was developed for adding the alveolar region airways using published rhesus morphometric data. The resultant lung geometry model can be used in mechanistic particle or gaseous dosimetry models. Such dosimetry models require estimates of the upper respiratory tract volume of the animal and the functional residual capacity, as well as of the tidal volume and breathing frequency of the animal. The relationship of these variables to rhesus monkeys of differing body weights was established by synthesizing and modeling published data as well as modeling pulmonary function measurements on 121 rhesus control animals. Deposition patterns of particles up to 10 µm in size were examined for endotracheal and and up to 5 µm for spontaneous breathing in infant and young adult monkeys and compared to those for humans. Deposition fraction of respirable size particles was found to be higher in the conducting airways of infant and young adult rhesus monkeys compared to humans. Due to the filtering effect of the conducting airways, pulmonary deposition in rhesus monkeys was lower than that in humans. Future research areas are identified that would either allow replacing assumptions or improving the newly developed lung model.
Acknowledgments
The authors wish to thank Mr. Earl Tewksberry for his assistance in determining the URT volume of nasal molds of rhesus monkeys.
Declaration of interest
This work was funded in part by the Defense Threat Reduction Agency via contract DTRA01-03-D-0014-0030. Nasal airway imaging and geometries were supported by funding from NIH P01 ES011617. All imaging, image processing, and lung geometry data acquisition was supported by grants from the National Heart, Lung, and Blood Institute (NHLBI R01 HL073598) and the National Institute of Environmental Health Sciences (NIEHS P01 ES011617) of the National Institutes of Health. A portion of this research was performed using EMSL, a national scientific user facility sponsored by the Department of Energy’s Office of Biological and Environmental Research and located at Pacific Northwest National Laboratory. The authors declare that they have no financial interest in the findings of this study.
Appendix A. Female rhesus monkey relationships among various variables
Figure A–1. For female rhesus monkeys, best fitting regression models showing the relationships among various variables and body weight or lung volume. Panel A: lung volume vs. body weight, with linear curve. Panel B: alveolar duct volume vs. body weight, with quadratic curve. Panel C: alveolar volume vs. lung volume, with linear curve. Panel D: log of the number of alveoli vs. lung volume, with a linear curve. See for the coefficients of the fitted regression models.
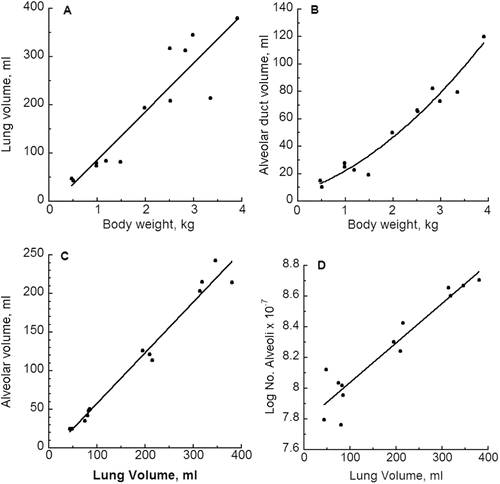
Table A–1. Best fitting regression models in female rhesus monkeys for various pulmonary variables.
Appendix B. Relationships of rhesus breathing parameters with body weight
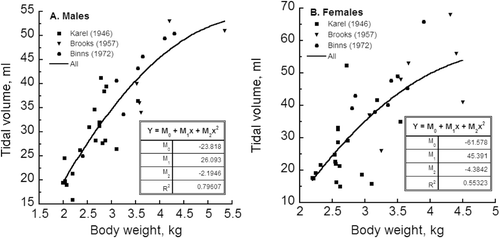
Tidal volume
Of the three studies reporting individual measurements of tidal volume on rhesus monkeys, two did not anesthetize the animals (Karel & Weston, 1946; Binns et al., 1972), while the study by Brooks et al. (1957) was on anesthetized animals. In that study, intraperitoneal injections of a mixture of 25% urethan solution and paraldehyde to give 1 g of urethan plus 0.2 mL of paraldehyde per kg of body weight were used. The body weight range of the animals in these three studies was 1.99–5.35 kg for male monkeys and was 2.19–4.5 kg for female monkeys.
Scatter plots of the VT data for each sex were used to identify animals whose data were well beyond the normal variability that one can expect in animals of a given body weight. If an animal was agitated or deeply anesthetized, the resulting alteration in breathing pattern would result in VT values not reflective of normal respiration. One male animal from each study was deleted from the VT data set: (1) an animal in the Karen and Weston (1946) study whose body weight was 53% greater than that of another animal, but still had about the same VT value, (2) an animal in the Binns et al. (1972) study that had a body weight of 3.45 kg had a VT only about 50% of that of another animal of similar size, while the other animal’s value was in line with trend line for animals of this and higher body weights, and (3) an animal in the Brooks et al. (1946) study had a VT value more than 50% greater than the VT value of other animals of similar body weight. The scatter plots for female rhesus monkeys did not reveal any animals whose tidal volume values should be considered as outliers.
A number of mathematical models were fit to the tidal volume data for each sex. Part A of provides the model coefficients and R2 values for the models fit to the male VT data, while Part B provides the results for the female monkeys. As can be seen from the table, a quadratic polynomial and an exponential rising model provided almost the same percentage of explanation of the variability in the data for both sexes as reflected by the R2 values. Given that the models are not to be used to predict VT values above the upper range of the data (i.e., about 5.35 kg), the simpler to evaluate quadratic model is recommended.
Table B–1. Mathematical models fit to tidal volume data for male and female rhesus monkeys.
The fitted curves and experimental data for the 3 studies are given in , and the regression equations for males and for females are given in Equations (B-1) and (B-2), respectively.
Figure B–1. The relationship between tidal volume and body weight for male and female rhesus monkeys over a body weight range of about 2 to 5 kg from analyses of studies reporting measurements on individual monkeys.
where VT is in mL and body weight is in kg.
Relative to extrapolating beyond the range of the experimental data to lower body weights, the data contained in Crosfill and Widdicombe (1961) provided support that going as low as 1.4 kg in body weight is probably okay for male monkeys. These investigators examined tidal volume in rhesus monkeys weighing as little as 1.8 kg, but they did not state which sex was used or if animals of both sexes were used. They reported a VT value of 9 mL as the lowest measurement, which likely was at this body weight; Eq. (B-1) gives a value of 8.4 mL for a body weight of 1.4 kg. If one has used females, extrapolation below 2 kg using Eq. (B-2) is not advised as this quadratic equation begins to provide VT estimates that rapidly decline and become negative. Thus, for female monkeys between 1.4 and 2 kg, use of the linear equation given in Part B of is recommended.
Minute volume
In the main body of this paper, the relationship between minute volume and body weight was examined for male rhesus monkeys. A logarithmic curve was shown to best describe the relationship between minute volume and body weight when the body weight was <4 kg, based upon a regression using the 3 studies that reported individual measurements of minute volume.
Here, a similar analysis is presented for female rhesus monkeys. Scatter plots of the 3 studies reporting individual measurements of minute volume did not reveal any animals whose minute volume values should be considered as outliers. The parameter estimates for various models fit to the female minute volume data set are given in Part B of . For completeness, the analogous results for the male monkeys are presented in Part A of the table. A quadratic polynomial also provided the best fit to the minute volume data for the female rhesus monkeys, although the logarithmic and exponential rising models were essentially as good as the quadratic over the range of the experimental data. The fitted curve and individual data points for the quadratic fit are given in and the corresponding equation for female minute volume as a function of body weight is given by Eq. (B-3).
Table B–2. Mathematical models fit to minute volume data for male and female rhesus monkeys.
Figure B–2. The relationship between minute volume and body weight of female rhesus monkeys over a body weight range of about 2 to 5 kg.
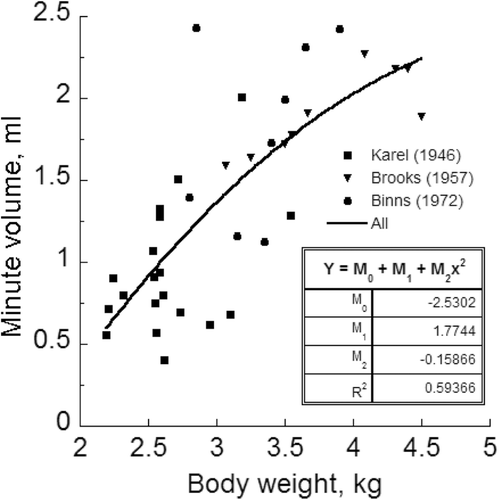
where minute volume is in L/min and body weight is in kg.