
Figures & data
Table 1. Demographic characteristics and GHC index at baseline, first follow-up (Q2) and change score for participants in the three cohorts with available serum samples at both baseline and follow-up.
Table 2. Dental treatment sessions with amalgam removal in the amalgam cohort.
Figure 1. Concentration of inorganic Hg in serum (µg Hg/L) in the Amalgam cohort (n = 30), MUPS cohort (n = 25) and in the Healthy cohort (n = 11) at baseline and first follow up. In the box plots upper and lower quartiles and median value are indicated. The highest and lowest values are indicated by the whiskers, while outliers are marked with a circle or an asterisk.
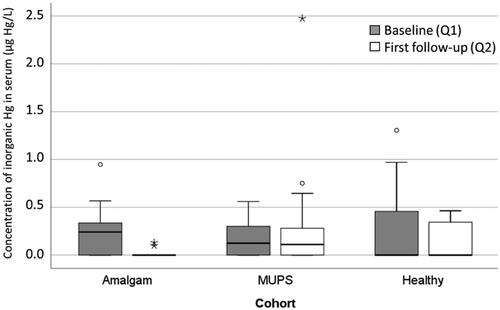
Table 3. Concentration of inorganic Hg (I-Hg), MeHg, Ag and Se in serum (µg/L) at baseline and follow-up.
Figure 2. Concentration of MeHg in serum (µg Hg/L) in the Amalgam cohort (n = 30), MUPS cohort (n = 25) and in the Healthy cohort (n = 11) at baseline and first follow up. For explanation of the box plots, see legend to .
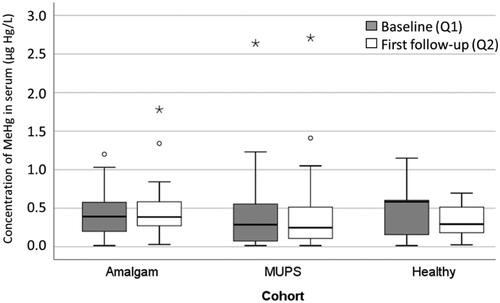
Figure 3. Concentration of Ag in serum (µg Ag/L) in the Amalgam cohort (n = 30), MUPS-cohort (n = 25) and in the Healthy cohort (n = 11) at baseline and first follow-up. For explanation of the box plots, see legend to .
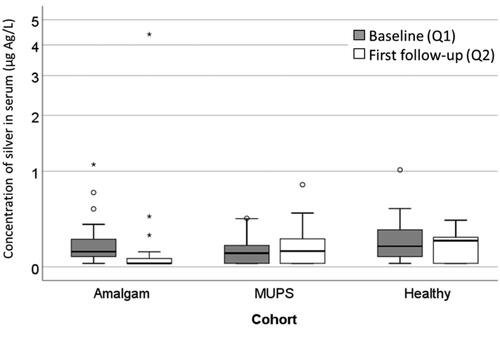
Figure 4. Concentration of Se in serum (µg Se/L) in the Amalgam cohort (n = 30), MUPS-cohort (n = 25) and in the Healthy cohort (n = 11) at baseline and follow-up. For explanation of the box plots, see legend to .
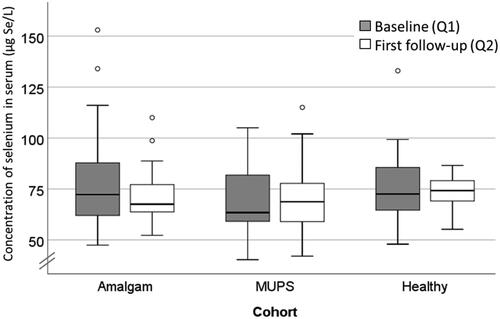
Figure 5. Concentration of I-Hg in serum (µg Hg/L) at baseline related to number of tooth surfaces filled with amalgam in the Amalgam cohort (n = 32).
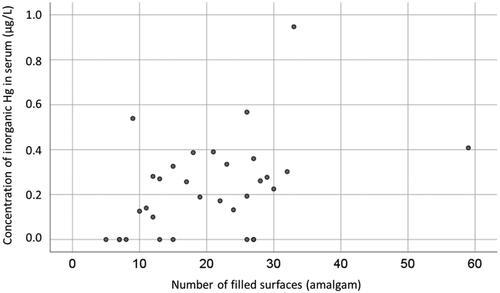
Figure 6. Concentration of Ag in serum (µg Ag/L) at baseline related to number of tooth surfaces filled with amalgam in the Amalgam cohort (n = 32).
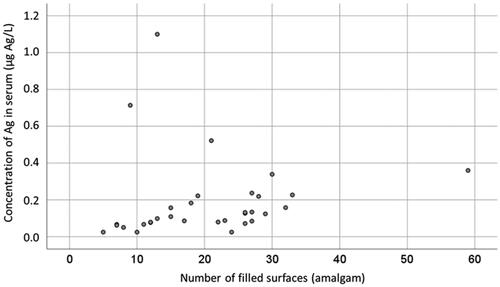
Table 4. Correlations between concentration of trace elements in serum (µg/L) at baseline and first follow-up for the Amalgam cohort (n = 30; upper part of table) and for the MUPS and Healthy cohorts (n = 36; lower part of the table).
Figure 7. Mean GHC index (and standard error) at baseline (Q1), and at first (Q2) and second follow-up (Q3). Mean index score at the second follow-up was estimated by use of linear mixed models.
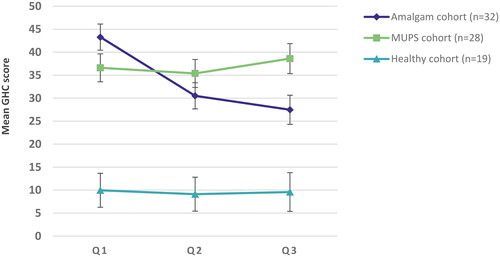
Table 5. Dental treatment procedures related to mean GHC change scores in the Amalgam cohort.