Figures & data
Table 1. Demographic data for each group separately and all participants together.
Figure 1. Difference in mean THI score between hearing impaired tinnitus participants (HIT) and normal hearing tinnitus participants (NHT). * = indicating significant difference, p-value <.05. Error bars depicting 1 standard deviation.
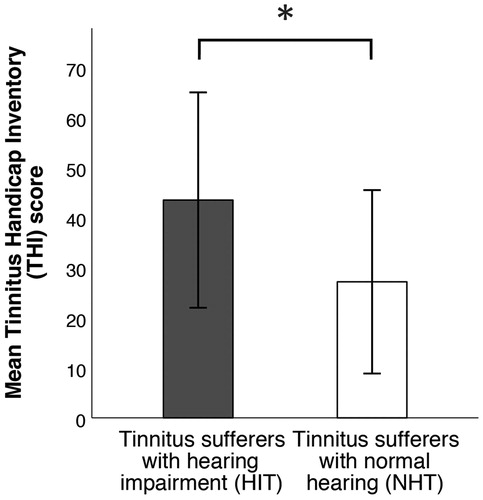
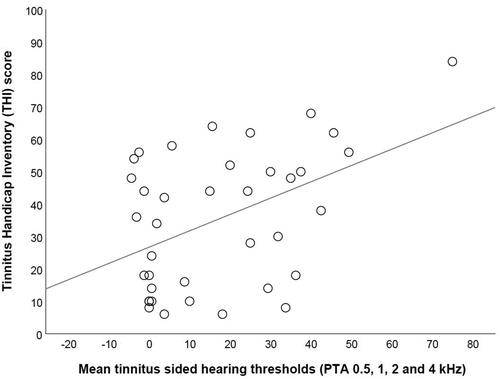
Figure 2. Correlation between THI score and mean tinnitus sided hearing thresholds at 0.5–4 kHz for all participants. Line depicting line of best fit.