
Figures & data
Figure 1. Cross-section of the cochlea showing ST and scala vestibuli (SV) (image courtesy of Prof. Thomas Lenarz from Hannover Medical School, Germany). The enlarged image of ST shows the basilar membrane on the top, outer wall on the right side, inner wall on the left side, and blood vessels on the floor of ST [Citation4]. Enlarged image reproduced by permission of Wolters Kluwer Health, Inc.
![Figure 1. Cross-section of the cochlea showing ST and scala vestibuli (SV) (image courtesy of Prof. Thomas Lenarz from Hannover Medical School, Germany). The enlarged image of ST shows the basilar membrane on the top, outer wall on the right side, inner wall on the left side, and blood vessels on the floor of ST [Citation4]. Enlarged image reproduced by permission of Wolters Kluwer Health, Inc.](/cms/asset/e381a453-e6ee-4425-a8c7-e4a421a30a19/ioto_a_1888505_f0001_c.jpg)
Figure 2. Scientists involved in the BIOEAR project, studied the neurotrophic effects of drugs in preserving and regrowing neurons in the inner ear.

Figure 3. Team of clinicians and scientists from 1ENT department- Johann Wolfgang Goethe University Hospital Frankfurt, Germany, 2Fujian Provincial Hospital, China, and 3Institute of Physiology- Johann Wolfgang Goethe University Hospital Frankfurt, Germany, 4MED-EL, who took part and supported this first study in evaluating the effectiveness of corticosteroids. In 2007, Dr Braun became a part of MED-EL.

Figure 4. Electrode array carrying two stimulating platinum contacts along with a two pin-connector for compound action potential (CAP) measurements (image courtesy of MED-EL).
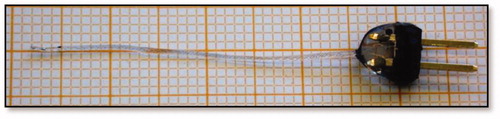
Figure 5. CAP threshold shift of middle frequencies (1–8 kHz). There is a difference in the time course of efficacy between the two glucocorticoids, on days 1 and 3. Significantly smaller threshold shifts were present in DEX ears, whereas in the Tria ears, this was the case on days 60 and 90 (A). No difference was seen between DEX and AP ears while hearing threshold shifts in the Tria ears were significantly bigger on days 14 and 90 (B). Efficacy of the pharmacological treatment in implanted ears was determined by subtracting the threshold shifts of the cochleostomy ears from the implanted ears (C). From the third day onwards, threshold shifts were significantly larger in untreated (AP) implanted ears, while the shifts in implanted ears treated with glucocorticoids did not differ from the equally treated nonimplanted ears [Citation15]. Statistical test: Wilcoxon-Mann-Whitney U test at α = 0.05. * p ≤ 0.05, ** p ≤ 0.01. Reproduced by permission of Karger AG, Basel.
![Figure 5. CAP threshold shift of middle frequencies (1–8 kHz). There is a difference in the time course of efficacy between the two glucocorticoids, on days 1 and 3. Significantly smaller threshold shifts were present in DEX ears, whereas in the Tria ears, this was the case on days 60 and 90 (A). No difference was seen between DEX and AP ears while hearing threshold shifts in the Tria ears were significantly bigger on days 14 and 90 (B). Efficacy of the pharmacological treatment in implanted ears was determined by subtracting the threshold shifts of the cochleostomy ears from the implanted ears (C). From the third day onwards, threshold shifts were significantly larger in untreated (AP) implanted ears, while the shifts in implanted ears treated with glucocorticoids did not differ from the equally treated nonimplanted ears [Citation15]. Statistical test: Wilcoxon-Mann-Whitney U test at α = 0.05. * p ≤ 0.05, ** p ≤ 0.01. Reproduced by permission of Karger AG, Basel.](/cms/asset/fea14e8d-d661-4a3a-b79b-987ee9132be0/ioto_a_1888505_f0005_b.jpg)
Figure 6. Tissue growth three months after surgery for all three groups. Statistical test: Spearman correlation analysis (2-tailed, α = 0.05). Histogram created from data given in Braun et al. [Citation15].
![Figure 6. Tissue growth three months after surgery for all three groups. Statistical test: Spearman correlation analysis (2-tailed, α = 0.05). Histogram created from data given in Braun et al. [Citation15].](/cms/asset/940a751f-229b-4ba7-9eeb-2d63e5046016/ioto_a_1888505_f0006_c.jpg)
Figure 7. Clinicians/researchers from the University of Ferrara, involved in the evaluation of electrode arrays of different stiffnesses for its aptitude to cause various degrees of HL.
Figure 8. Soft and stiff electrodes fabricated by MED-EL for this study (A). Average threshold shifts in dB SPL at the high-frequency band (16 + 32 kHz) (B) and at low-frequency bands (4 + 8 kHz), (C) measured immediately after the surgery (t = 0 days) and at t = 3, 7, 14 and 30 days postoperatively [Citation16]. Statistical analysis: unpaired t-test (p < .05). Reproduced by permission of Wolters Kluwer Health, Inc.
![Figure 8. Soft and stiff electrodes fabricated by MED-EL for this study (A). Average threshold shifts in dB SPL at the high-frequency band (16 + 32 kHz) (B) and at low-frequency bands (4 + 8 kHz), (C) measured immediately after the surgery (t = 0 days) and at t = 3, 7, 14 and 30 days postoperatively [Citation16]. Statistical analysis: unpaired t-test (p < .05). Reproduced by permission of Wolters Kluwer Health, Inc.](/cms/asset/2e26a8cb-2609-4825-8d17-a7749db1b5cf/ioto_a_1888505_f0008_b.jpg)
Figure 9. Mean CAP threshold shifts after extracochlear application of triamcinolone, showing higher values for steroid group compared to the control ear, starting two weeks postoperation until the end of the study, at week 4 (A). Mean maximal amplitudes of CAP in response to click stimuli increased significantly on days 14, 21 and 28 for the steroid groups with the extracochlear application, compared to control ears (B). For the intracochlear steroid application, the steroid group showed significantly lower mean threshold shifts compared to the control ears (C), and the mean maximum amplitudes started to recover from day 14 in the steroid group, which was about 1 week earlier than in control group (D) [Citation17]. Statistical test: paired t-test was used to analyse pre-op and post-op results within groups; Mann-Whitney U-test was used for comparison of group results (p < .05). Reproduced by permission of Wolters Kluwer Health, Inc.
![Figure 9. Mean CAP threshold shifts after extracochlear application of triamcinolone, showing higher values for steroid group compared to the control ear, starting two weeks postoperation until the end of the study, at week 4 (A). Mean maximal amplitudes of CAP in response to click stimuli increased significantly on days 14, 21 and 28 for the steroid groups with the extracochlear application, compared to control ears (B). For the intracochlear steroid application, the steroid group showed significantly lower mean threshold shifts compared to the control ears (C), and the mean maximum amplitudes started to recover from day 14 in the steroid group, which was about 1 week earlier than in control group (D) [Citation17]. Statistical test: paired t-test was used to analyse pre-op and post-op results within groups; Mann-Whitney U-test was used for comparison of group results (p < .05). Reproduced by permission of Wolters Kluwer Health, Inc.](/cms/asset/3f3d1652-51f9-4574-8661-4f85b83341b7/ioto_a_1888505_f0009_c.jpg)
Figure 10. Prof. Christoph Arnoldner from the Medical University of Vienna.
Figure 11. CAP threshold shifts at different frequency ranges. (A) Low, (B) middle, (C) high frequencies. Symbol indicate p < .05. *6% TAAC versus control; +30% TAAC versus control. Error bars indicate standard deviation. CAP threshold shifts recovered significantly better in the TAAC-treated groups [Citation18]. Reproduced by permission of Karger AG, Basel.
![Figure 11. CAP threshold shifts at different frequency ranges. (A) Low, (B) middle, (C) high frequencies. Symbol indicate p < .05. *6% TAAC versus control; +30% TAAC versus control. Error bars indicate standard deviation. CAP threshold shifts recovered significantly better in the TAAC-treated groups [Citation18]. Reproduced by permission of Karger AG, Basel.](/cms/asset/a0f37612-0384-42a1-8e2c-1f2966791cb9/ioto_a_1888505_f0011_b.jpg)
Figure 12. Clinicians from the Hannover Medical School, Germany, who evaluated the effectiveness of ACEMg in preserving residual hearing.

Figure 13. Mean HL over time in ACEMg and placebo group. At all observed time points, the HL in the placebo group was higher compared to the HL detected in the ACEMg group. In both groups, the HL increased over time. Adapted from Scheper et al. published in Trials [Citation21].
![Figure 13. Mean HL over time in ACEMg and placebo group. At all observed time points, the HL in the placebo group was higher compared to the HL detected in the ACEMg group. In both groups, the HL increased over time. Adapted from Scheper et al. published in Trials [Citation21].](/cms/asset/733bf0d8-c6dc-4bac-8957-1ffa04c6bec1/ioto_a_1888505_f0013_c.jpg)
Figure 14. Clinicians from the University of Miami Ear Institute, USA, who were involved in the early studies designing the models for implantation trauma, and in evaluating the efficacy of steroids and antioxidants.

Figure 15. DEX treatment conserved auditory function thresholds at 16 kHz after electrode insertion trauma. Group-1: control ears (n = 44) (A), group-2: electrode insertion trauma (EIT, n = 15) (B), group-3: EIT + AP (n = 15) (C), and group-4: EIT + DEX (n = 14) (D). Statistical test: Analysis of variance with post hoc tests (Tukey-Kramer honestly significant difference) (p < .05). Graph created from data given in Vivero et al. [Citation22].
![Figure 15. DEX treatment conserved auditory function thresholds at 16 kHz after electrode insertion trauma. Group-1: control ears (n = 44) (A), group-2: electrode insertion trauma (EIT, n = 15) (B), group-3: EIT + AP (n = 15) (C), and group-4: EIT + DEX (n = 14) (D). Statistical test: Analysis of variance with post hoc tests (Tukey-Kramer honestly significant difference) (p < .05). Graph created from data given in Vivero et al. [Citation22].](/cms/asset/22b0a67a-6955-4ba2-b984-552da868f11b/ioto_a_1888505_f0015_c.jpg)
Figure 16. Silicone-made CI electrode dummies for non-human subject implantation with and without DEX load. The black dot indicates the insertion depth of 3 mm (Image courtesy of MED-EL).
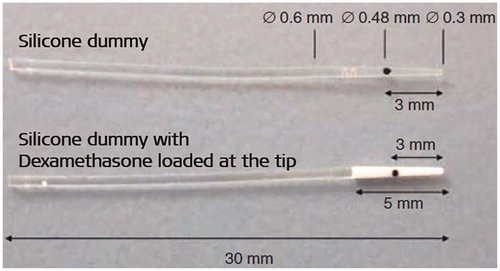
Figure 17. ABR thresholds (solid red line: DEX group, black dashed line: control group) with tone-bursts with carrier frequencies of 1 kHz (A) and 16 kHz (B). H&E staining showed TNF-α positive cells in new fibrous tissue (C1), spiral ganglion cells (C2), spiral ligament (C3), and in the organ of Corti (C4) [Citation24]. Statistical test: Differences between groups were compared using the nonparametric Mann-Whitney U test for two independent samples (p < .05). Reproduced by permission of Elsevier B.V.
![Figure 17. ABR thresholds (solid red line: DEX group, black dashed line: control group) with tone-bursts with carrier frequencies of 1 kHz (A) and 16 kHz (B). H&E staining showed TNF-α positive cells in new fibrous tissue (C1), spiral ganglion cells (C2), spiral ligament (C3), and in the organ of Corti (C4) [Citation24]. Statistical test: Differences between groups were compared using the nonparametric Mann-Whitney U test for two independent samples (p < .05). Reproduced by permission of Elsevier B.V.](/cms/asset/81a8e6bc-9cce-47eb-97d6-dc657ceda2a2/ioto_a_1888505_f0017_c.jpg)
Figure 18. ENT surgeons from clinics in Germany: 1Technical University of Munich, 2Institute of Infectious Diseases and Zoonoses-Faculty of Veterinary Medicine- Munich, and their colleagues who were involved in evaluating if DEX could enhance postoperative infections following CI treatment.
Figure 19. Experimental group implanted with DEX eluting electrode developed meningitis in 4/15 (27%) subjects, and the experimental group implanted with non-eluting electrode dummies developed meningitis in 3/15 (20%) subjects (A) [Citation25]. Reproduced by permission of Taylor and Francis Group. Mid-modiolar section of the cochleae showed the presence of inflammatory cells in the subjects that got meningitis (B1), and no presence of inflammatory cells in the subjects that did not get the meningitis infection (B2) [Citation26]. Statistical tests: Mann-Whitney U test and Fisher’s exact test (p < .05). Reproduced by permission of Elsevier B.V.
![Figure 19. Experimental group implanted with DEX eluting electrode developed meningitis in 4/15 (27%) subjects, and the experimental group implanted with non-eluting electrode dummies developed meningitis in 3/15 (20%) subjects (A) [Citation25]. Reproduced by permission of Taylor and Francis Group. Mid-modiolar section of the cochleae showed the presence of inflammatory cells in the subjects that got meningitis (B1), and no presence of inflammatory cells in the subjects that did not get the meningitis infection (B2) [Citation26]. Statistical tests: Mann-Whitney U test and Fisher’s exact test (p < .05). Reproduced by permission of Elsevier B.V.](/cms/asset/2a3bd81d-b999-42cc-aff3-f535cd57af78/ioto_a_1888505_f0019_c.jpg)
Figure 20. Researchers from Iran Polymer and Petrochemical Institute (IPPI) and MED-EL who studied the feasibility of fabricating hybrid electrode array by mixing DEX to the medical-grade silicone.

Figure 21. Total cumulative amount of DEX (µg) released from devices loaded in different percentages of DEX (0.25%–2% w/w) for 600 days release time (A). The daily dosage of DEX released (µg/day) from devices (B). Plot and histogram created from data given in Ghavi et al. [Citation27].
![Figure 21. Total cumulative amount of DEX (µg) released from devices loaded in different percentages of DEX (0.25%–2% w/w) for 600 days release time (A). The daily dosage of DEX released (µg/day) from devices (B). Plot and histogram created from data given in Ghavi et al. [Citation27].](/cms/asset/c1314f66-4774-480b-b1a3-5bfdec480f25/ioto_a_1888505_f0021_c.jpg)
Figure 22. Top: picture of MED-EL’s DEX-eluting electrode array with the DEX-containing silicone rings, loaded between the stimulating electrode channels (image courtesy of MED-EL). Bottom: Chemist and Pharmacologist from MED-EL who were heavily involved in the development of DEXEL.
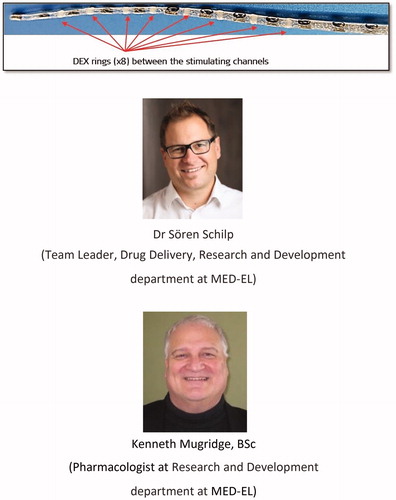
Figure 23. DEX-eluting electrode arrays with DEX concentration of 10% and 0% (A) (image courtesy of MED-EL). ABR thresholds (B), CAP thresholds (C) and electrode impedance (D) of all the experimental groups implanted with electrode arrays loaded with DEX of concentrations 0.0%, 0.1%, 1.0% and 10.0% (w/w). Semi-quantitative analysis of fibrous tissue in cochlea samples implanted with electrode array loaded with different concentrations of DEX (E) [Citation29]. Statistical test: Two-way ANOVA with Bonferroni posthoc testing was applied for ABR and CAP threshold comparisons and impedance comparisons between groups. One-way ANOVA with Tukey’s post-test was applied for scala tympani fibrosis histology studies (p < .05). Reproduced by permission of Elsevier B.V.
![Figure 23. DEX-eluting electrode arrays with DEX concentration of 10% and 0% (A) (image courtesy of MED-EL). ABR thresholds (B), CAP thresholds (C) and electrode impedance (D) of all the experimental groups implanted with electrode arrays loaded with DEX of concentrations 0.0%, 0.1%, 1.0% and 10.0% (w/w). Semi-quantitative analysis of fibrous tissue in cochlea samples implanted with electrode array loaded with different concentrations of DEX (E) [Citation29]. Statistical test: Two-way ANOVA with Bonferroni posthoc testing was applied for ABR and CAP threshold comparisons and impedance comparisons between groups. One-way ANOVA with Tukey’s post-test was applied for scala tympani fibrosis histology studies (p < .05). Reproduced by permission of Elsevier B.V.](/cms/asset/e7c5b3ed-cdac-4327-81ab-7ead25f1956d/ioto_a_1888505_f0023_c.jpg)
Figure 24. Immunostained organ of Corti ninety days post-EIT showing the normal presence of OHC, IHC and nerve fibres in the control specimen with no EIT. Absence of nerve fibres and missing IHC and OHC in specimens that had EIT but no DEX. Presence of OHC and nerve fibres in specimens that had EIT and 1.0% of DEX [Citation29]. Reproduced by permission of Elsevier B.V.
![Figure 24. Immunostained organ of Corti ninety days post-EIT showing the normal presence of OHC, IHC and nerve fibres in the control specimen with no EIT. Absence of nerve fibres and missing IHC and OHC in specimens that had EIT but no DEX. Presence of OHC and nerve fibres in specimens that had EIT and 1.0% of DEX [Citation29]. Reproduced by permission of Elsevier B.V.](/cms/asset/8b093a85-caba-4364-a4bb-23ba80cbf6be/ioto_a_1888505_f0024_c.jpg)
Figure 25. Electrode arrays have two active contacts (the first contact is more basal and the second more apical), and a black marker dot at 3 mm length from the apical end indicates insertion depth (images courtesy of MED-EL). Control electrode array without DEX (0%) (A), electrode arrays containing 1% DEX (16 ng/day delivery rate) (B), and electrode array containing 10% DEX (49 ng/day delivery rate) (C). Connective tissue formation in the ST of implanted ears treated with 1%, 10% or 0% DEX. Tissue growth is plotted as the percentage area filled in the ST. Mean tissue growth for the whole cochlear length analysed (basal turn) showing a significant difference between the 10% DEX treated cochleae and 0% DEX (D). Correlation between tissue growth and impedance; tissue growth around the electrode array significantly correlated with the measured impedance on the more apical electrode (E) [Citation30]. Statistical analysis: Shapiro-Wilk normality test and Spearman-Rho nonparametric correlation tests were used (p < .05). Adapted from Wilk et al published in PLOSONE [Citation30].
![Figure 25. Electrode arrays have two active contacts (the first contact is more basal and the second more apical), and a black marker dot at 3 mm length from the apical end indicates insertion depth (images courtesy of MED-EL). Control electrode array without DEX (0%) (A), electrode arrays containing 1% DEX (16 ng/day delivery rate) (B), and electrode array containing 10% DEX (49 ng/day delivery rate) (C). Connective tissue formation in the ST of implanted ears treated with 1%, 10% or 0% DEX. Tissue growth is plotted as the percentage area filled in the ST. Mean tissue growth for the whole cochlear length analysed (basal turn) showing a significant difference between the 10% DEX treated cochleae and 0% DEX (D). Correlation between tissue growth and impedance; tissue growth around the electrode array significantly correlated with the measured impedance on the more apical electrode (E) [Citation30]. Statistical analysis: Shapiro-Wilk normality test and Spearman-Rho nonparametric correlation tests were used (p < .05). Adapted from Wilk et al published in PLOSONE [Citation30].](/cms/asset/59f3acc4-54c8-49e2-8511-4189cc0d1c7d/ioto_a_1888505_f0025_c.jpg)
Figure 26. ENT surgeons from the University of Navarra in Pamplona, Spain, performed the CI surgeries in ten non-human primates Macaca fascicularis to evaluate the safety and efficacy of DEX-eluting electrode array.
Figure 27. The postsurgical image showing six stimulating channels inside the non-human primate’s cochlea (A) (image courtesy of Prof. Manrique). Mean impedance values from all six stimulating channels showing lower impedance values for the DEX-eluting electrode group, compared to the control group (B). eCAP responses to 800cu stimulation showed that the DEX-eluting electrode group had higher eCAP amplitudes on average, compared to the control group (C). eCAP recovery function showed shorter recovery times for the DEX-eluting electrode group, starting two months post-surgery, lasting until the end of the study (D) [Citation31]. Statistical analysis: Student’s t-test with Wilcoxon Man-Whitney U test (p < .05). Reproduced by permission of Wolters Kluwer Health, Inc.
![Figure 27. The postsurgical image showing six stimulating channels inside the non-human primate’s cochlea (A) (image courtesy of Prof. Manrique). Mean impedance values from all six stimulating channels showing lower impedance values for the DEX-eluting electrode group, compared to the control group (B). eCAP responses to 800cu stimulation showed that the DEX-eluting electrode group had higher eCAP amplitudes on average, compared to the control group (C). eCAP recovery function showed shorter recovery times for the DEX-eluting electrode group, starting two months post-surgery, lasting until the end of the study (D) [Citation31]. Statistical analysis: Student’s t-test with Wilcoxon Man-Whitney U test (p < .05). Reproduced by permission of Wolters Kluwer Health, Inc.](/cms/asset/27faf314-c7a8-45bc-97a5-1080b0d1983c/ioto_a_1888505_f0027_c.jpg)
Figure 28. Team of clinicians from 1Martin Luther University Halle-Wittenberg, Germany, 2Technical University of Munich, Germany, 3HNO-Zentrum, Regensburg, Germany, and their colleagues, were involved in the pharmacokinetic study of dexamethasone-releasing silicone CI electrode array. Dr Ya Liu was a PhD student at the time at the Technical University of Munich, but originally from Beijing Naval General Hospital, China. *Image courtesy of Prof. Stefan Plontke: Fotostelle Universitätsmedizin Halle.
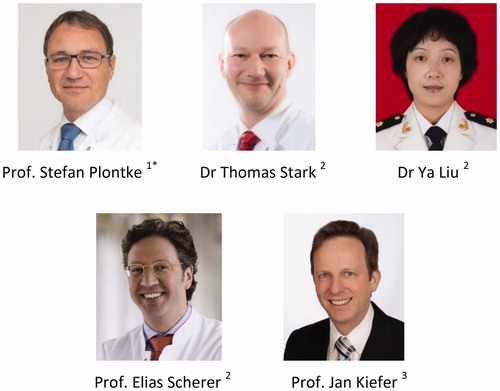
Figure 29. Real-time concentrations in groups A and B from the in-vitro experiment. The concentration in group B was consistently higher than in group A for fifteen weeks, although the difference between the two groups became smaller over time. After the sixteenth week, there was no difference in concentration between the two groups (A). DEX concentration-time curves in subjects’ perilymph (B). The image on the top right represents a detailed display of the curves within 7 h after implantation. The peak concentration occurred 30 min after surgery in both groups and then decreased rapidly until 3 h after surgery. From 3 h to one day, the perilymph concentration in the 10% DEX group was significantly higher than in the 2% DEX group, after which the difference became non-significant [Citation32]. Statistical test: differences between the groups were compared using the nonparametric Mann-Whitney U test for two independent samples (p < .05). Reproduced by permission of Springer Nature.
![Figure 29. Real-time concentrations in groups A and B from the in-vitro experiment. The concentration in group B was consistently higher than in group A for fifteen weeks, although the difference between the two groups became smaller over time. After the sixteenth week, there was no difference in concentration between the two groups (A). DEX concentration-time curves in subjects’ perilymph (B). The image on the top right represents a detailed display of the curves within 7 h after implantation. The peak concentration occurred 30 min after surgery in both groups and then decreased rapidly until 3 h after surgery. From 3 h to one day, the perilymph concentration in the 10% DEX group was significantly higher than in the 2% DEX group, after which the difference became non-significant [Citation32]. Statistical test: differences between the groups were compared using the nonparametric Mann-Whitney U test for two independent samples (p < .05). Reproduced by permission of Springer Nature.](/cms/asset/e9dc22b7-08f4-4ddf-b08f-edd663500353/ioto_a_1888505_f0029_c.jpg)
Figure 30. Dependence of perilymph DEX concentration in the ST of implanted cochleae with 0.1%, 1% and 10% loaded DEX silicone rods after implantation. A burst release phase lasting 1–7 days—depending on silicone drug loading—was followed by a steady-state phase characterised by constant drug concentrations. Adapted from Liebau et al published in Frontiers in Neurology [Citation33].
![Figure 30. Dependence of perilymph DEX concentration in the ST of implanted cochleae with 0.1%, 1% and 10% loaded DEX silicone rods after implantation. A burst release phase lasting 1–7 days—depending on silicone drug loading—was followed by a steady-state phase characterised by constant drug concentrations. Adapted from Liebau et al published in Frontiers in Neurology [Citation33].](/cms/asset/8b576b68-9f73-4d5c-8a0e-847ad2abbdce/ioto_a_1888505_f0030_c.jpg)
Figure 31. Silicone dummy of a STANDARD electrode array from MED-EL, with an open channel that runs through the length of the array (image courtesy of MED-EL).
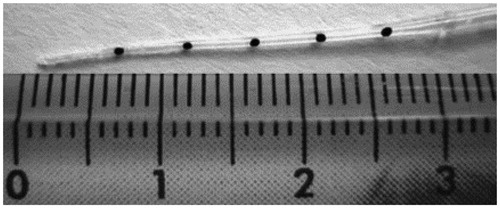
Figure 32. A team of ENT surgeons from 1University of Lyon, France, and 2Johann Wolfgang Goethe University Hospital Frankfurt, Germany, along with engineers from MED-EL, who were involved in the evaluation of safety and functionality of IEC in cadaveric cochleae.
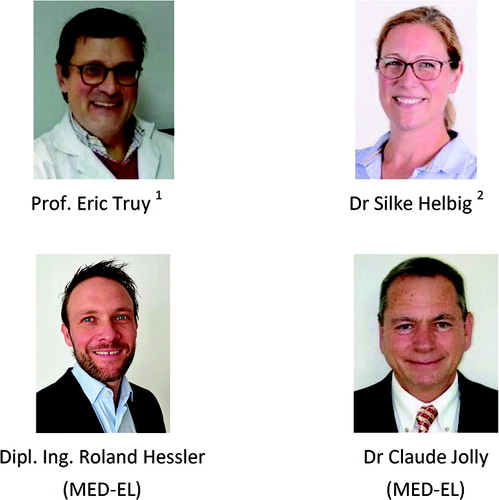
Figure 33. The back end of the catheter merged with a Luer lock system for the glass Hamilton syringe to be connected (A). The iodine solution was injected using the catheter, which stayed in the ST even in the second turn of the cochlea, as seen in CT imaging (B). Histological analysis of the cochlea with the catheter inside showed the presence of catheter wholly positioned in the ST with no deviation to SV (C). CI electrode array insertion, following the catheter removal, stayed completely inside the ST, as seen in the CT imaging (D) and the corresponding histological analysis visually confirmed the ST position (E) [Citation35]. Reproduced by permission of Wolters Kluwer Health, Inc.
![Figure 33. The back end of the catheter merged with a Luer lock system for the glass Hamilton syringe to be connected (A). The iodine solution was injected using the catheter, which stayed in the ST even in the second turn of the cochlea, as seen in CT imaging (B). Histological analysis of the cochlea with the catheter inside showed the presence of catheter wholly positioned in the ST with no deviation to SV (C). CI electrode array insertion, following the catheter removal, stayed completely inside the ST, as seen in the CT imaging (D) and the corresponding histological analysis visually confirmed the ST position (E) [Citation35]. Reproduced by permission of Wolters Kluwer Health, Inc.](/cms/asset/e171ec0b-1d9c-4242-a91a-82b232056bd8/ioto_a_1888505_f0033_c.jpg)
Figure 34. Chemist and engineer from MED-EL who were part of the team reconfiguring the catheter design.
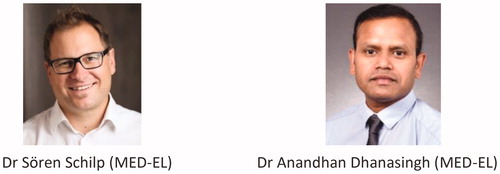
Figure 35. Version 1 of the IEC with Luer lock mechanism, connecting the Hamilton glass syringe to the backend of the catheter (A). Reconfigured catheter design with silicone reservoir with a septum at the back end of the catheter, and the reduction of intracochlear part of catheter length to 20 mm (B). Insulin syringe needle piercing and filling the reservoir with a drug solution (C). The current version of the commercially available IEC (D). Image courtesy of MED-EL.
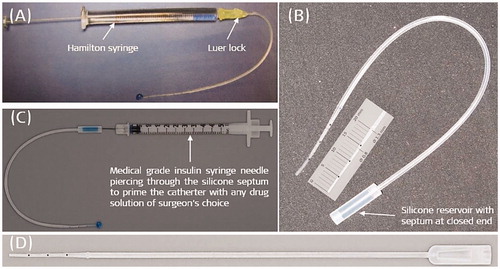
Figure 36. Clinicians from Hannover Medical University, Germany, took part in evaluating the ease of use of IEC in regular CI surgeries.
Figure 37. Insulin syringe needle pierced into the silicone reservoir (A) (Image courtesy of MED-EL). The IEC immediately after removing it from the cochlea (B) (Image courtesy of Prof. Thomas Lenarz, Hannover, Germany). Average impedance values of twelve stimulating electrode channels for the two different dosed triamcinolone compared to the control group (C). Adapted from Prenzler et al published in Frontiers in Neurology [Citation36].
![Figure 37. Insulin syringe needle pierced into the silicone reservoir (A) (Image courtesy of MED-EL). The IEC immediately after removing it from the cochlea (B) (Image courtesy of Prof. Thomas Lenarz, Hannover, Germany). Average impedance values of twelve stimulating electrode channels for the two different dosed triamcinolone compared to the control group (C). Adapted from Prenzler et al published in Frontiers in Neurology [Citation36].](/cms/asset/1e051e85-34e3-48fe-964e-68f2c55b8a4b/ioto_a_1888505_f0037_c.jpg)