Figures & data
Figure 1. Etiology of Japanese CI children (n = 308). Orange indicates non-syndromic hearing loss associated with specific gene mutations, green indicates syndromic HL, blue indicates inner ear anomalies, light blue indicates cochlear nerve deficiencies, yellow indicates congenital CMV infection- or mumps-associated HL, and gray indicates the patients with unknown etiology.
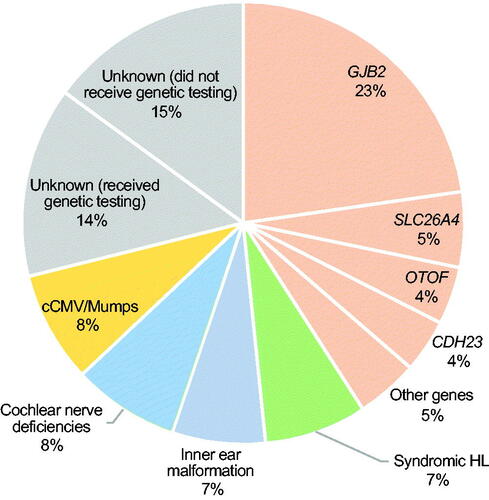
Figure 2. Frequencies of cases with associated developmental disorders in each etiological group (n = 308). Blue indicates the cases without a diagnosis of developmental disorder, orange indicates MR cases, light pink indicates ADD or ADHD cases, yellow indicates ASD cases, and pink indicates PDD cases.
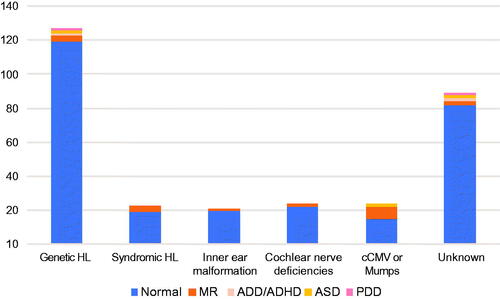
Figure 3. Auditory skill development pre- and post-CI in each etiological group. (A) Mean IT-MAIS scores pre-operation and at 3, 6, 12, and 18 months after CI fitting for each etiological group. (B) Mean MUSS scores pre-operation and at 3, 6, 12, and 18 months after CI fitting for each etiological group. Orange indicates the non-syndromic HL associated with specific gene mutations group, green indicates the syndromic HL group, blue indicates the inner ear anomaly group, light blue indicates the cochlear nerve deficiencies group, yellow indicates the congenital CMV infection-associated HL group, and gray indicates the patients with unknown etiology.
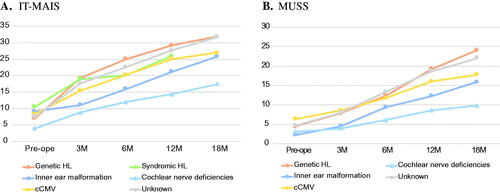
Figure 4. Total developmental test results for each etiological group. (A) The results of the Kyoto Scale of Psychological Development 2001 (KSPD) test performed at an age of 4–5 year for each etiological group. The vertical axis shows developmental quotients (DQs), with a score of 100 indicating age-appropriate development against normal controls. (B) The results of WISC-IV for each etiological group. Orange indicates the non-syndromic HL associated with specific gene mutations group, green indicates the syndromic HL group, blue indicates the inner ear anomaly group, light blue indicates the cochlear nerve deficiencies group, yellow indicates the congenital CMV infection- or mumps-associated HL group, and gray indicates the patients with unknown etiology. Asterisks indicated a statistical significance on Tukey’s HSD test.
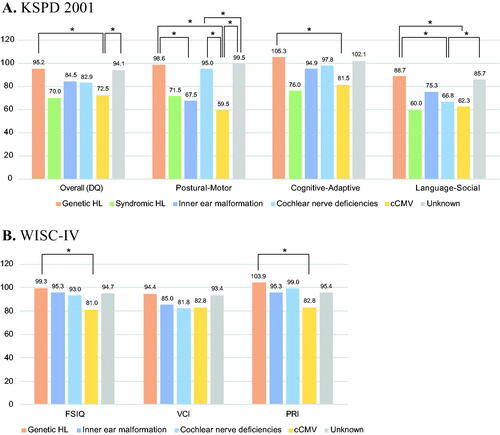
Figure 5. Japanese monosyllable speech perception test and Speech Intelligibility Rating results for each etiological group. (A) The results of the Japanese monosyllable speech perception test performed at age 6–8 years for each etiological group. The vertical axis shows the percentage (%) of correct answers at the most comfortable sound pressure level. (B) The results of Speech Intelligibility Rating (SIR) accessed at age 6–8 years for each etiological group. Orange indicates the non-syndromic HL associated with specific gene mutations group, blue indicates the inner ear anomaly group, light blue indicates the cochlear nerve deficiencies group, yellow indicates the congenital CMV infection- or mumps-associated HL group, and gray indicates the patients with unknown etiology. Asterisks indicate a statistical significance on Tukey’s HSD test.
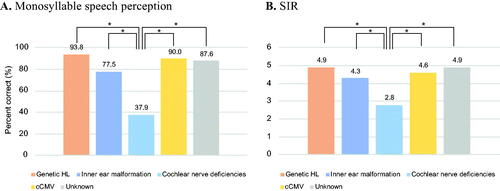
Figure 6. Vocabulary development in each etiological group. The results of the revised version of the picture vocabulary test (PVT-R) performed at age 4–5, 6–8, and 9–11 years for each etiological group. The vertical axis shows the Scaled Score (SS), with 10 indicating the average score for normal control subjects. Orange indicates non-syndromic HL associated with specific gene mutations group, blue indicates the inner ear anomaly group, light blue indicates the cochlear nerve deficiencies group, yellow indicates the congenital CMV infection- or mumps-associated HL group, and gray indicates the patients with unknown etiology.
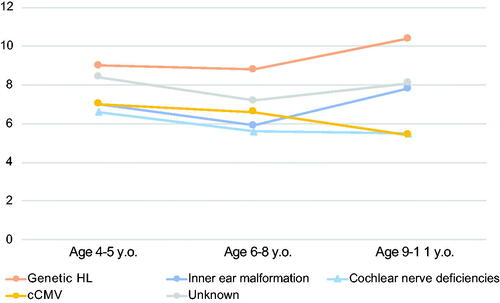
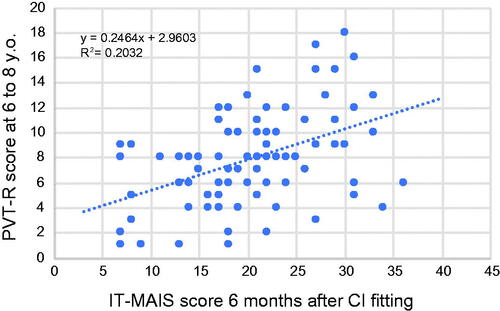
Figure 7. Correlation between early auditory skill development and vocabulary development at school age. The vertical axis shows the Scaled Score (SS) of the PVT-R test performed at age 6–8 years. A score of 10 indicates the average score for normal control subjects. The horizontal axis shows the IT-MAIS score at 6 months after CI fitting.