Figures & data
Figure 1. Electromagnetic field generator for seed treatment.
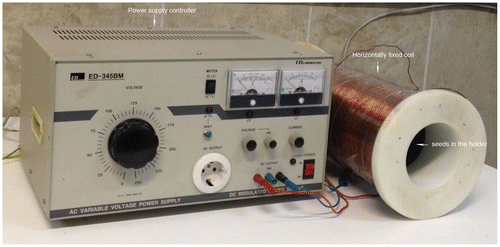
Table 1. Results of RAPD analysis of maize and canola plants under electromagnetic field treatment.
Table 2. Effect of EMF treatment on some growth parameters and protein content in maize (M1–M3) and canola (C1–C3) seedlings.
Figure 2. Effect of different EMF treatments on growth of maize and canola seedlings. Control (M1), 3 mT (M2) and 10 mT (M3) for 4 h in maize, and control (C1), 1 mT for 1 h (C2) and 7 mT for 3 h (C3) in canola.
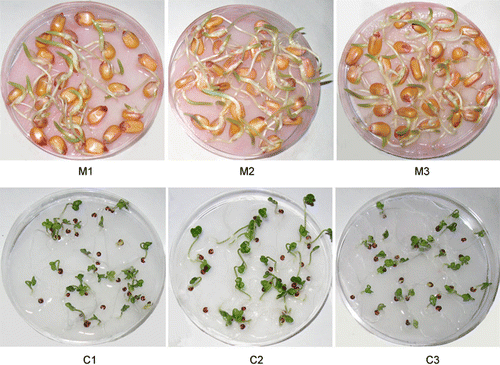
Figure 3. Effect of different EMF treatments on RAPD profiles of maize and canola seedlings by (A) OPC-08 and (B) OPC-01 primers, respectively. Control (M1), 3 mT (M2) and 10 mT (M3) for 4 h in maize, control (C1), 1 mT for 1 h (C2) and 7 mT for 3 h (C3) in canola.
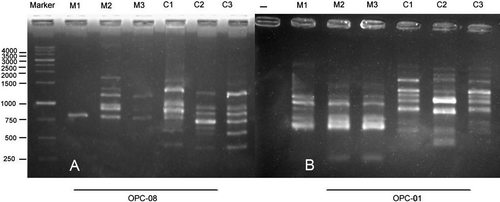
Figure 4. Effect of different EMF treatments on RAPD profiles of maize and canola seedlings by (A) OPR-02 and (B) OPR-08 primers, respectively. Control (M1), 3 mT (M2) and 10 mT (M3) for 4 h in maize, control (C1), 1 mT for 1 h (C2) and 7 mT for 3 h (C3) in canola.
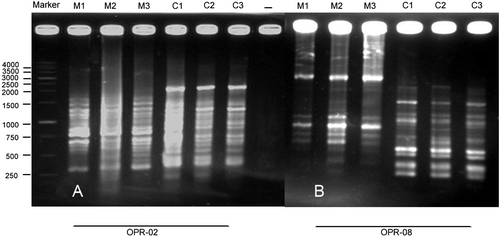
Figure 5. Dendrogram resulting from UPGMA cluster and POC plot based on RAPD data from control, 3 and 10 mT for 4 h in maize.
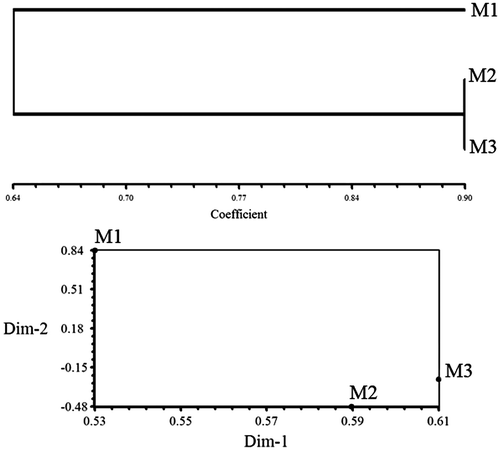
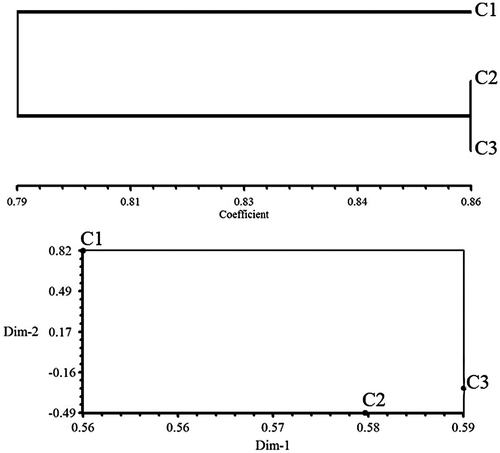
Figure 6. Dendrogram resulting from UPGMA cluster and POC plot based on RAPD data from control, 1 mT for 1 h, 7 mT for 3 h in canola.