Figures & data
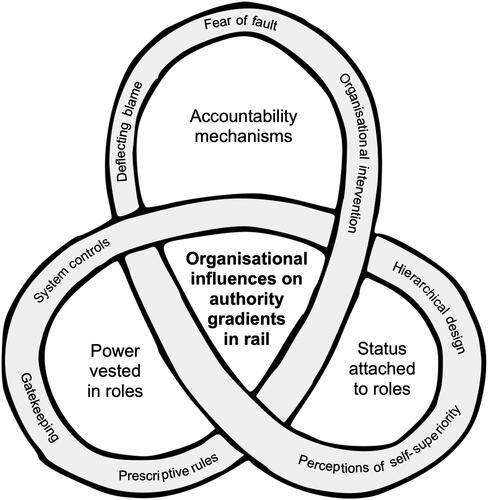
Figure 1. Authority gradients between multidisciplinary operational teams are influenced by status/value relationships with authority/power (from Luva and Naweed Citation2022). Note: Terminology is Australian domain specific, and box-shading is representative of operational teams that are co-located.
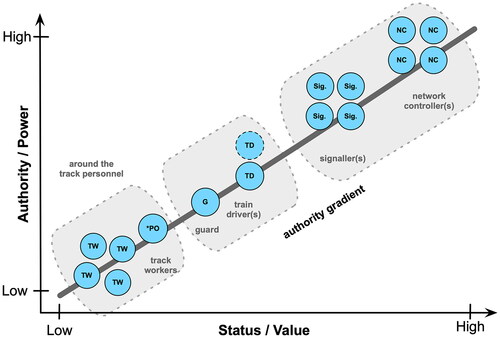
Figure 2. Themes (inner-circle) and subthemes (outer-circle) forming the basis of thematic analysis in companion paper, Authority Gradients Between Rail Network Controllers, Train Crew & Track Workers in Australia & New Zealand—Motivations & Behaviours (Luva and Naweed Citation2023).
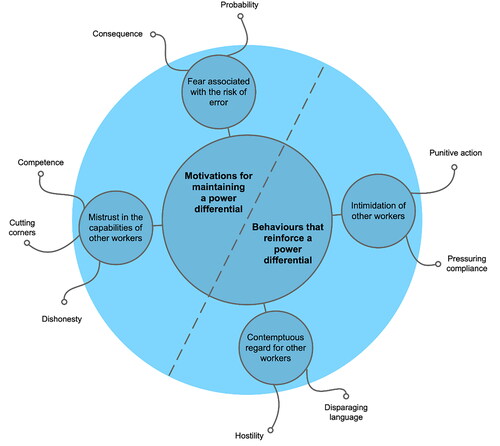
Figure 3. Overview of the interview protocol (read left to right). Example questions illustrated Part One and the key steps involved in the SITT outlined in Part Two.
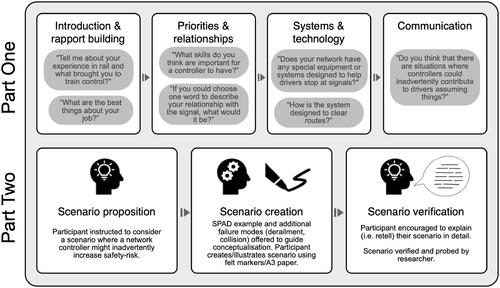
Figure 4. An example SITT scenario created by a study participant during interviews, reflecting a confluence of factors which they perceived might lead to a network controller inadvertently increasing safety risk. Handwriting has been replaced with typescript. The drawing itself displays a topographical formalism analogous with how rail and interlocking is presented to network controllers on mimic boards. The scenario itself depicts a potential for collision due to lack of clear and concise instructions from the network controller. In this scenario, the train consist (shown as blue rectangles travelling from right to left and referred to as a ‘unit’ by this participant) is incorrectly directed onto the main line (the principal arterial line in the system) instead of the branch line (a secondary railway line). The unit is stopped and a conversation occurs between the driver and the network controller. The driver assumes he has authority to move the train backwards, and starts moving it so that it is on the approach side of Signal 36—the signal the unit has just passed. However, the network controller has not given this authority and another train (shown as a red-coloured rectangles on the bottom-right of the picture) is already on approach to signal 36. The blue unit risks colliding with the oncoming red unit. This scenario is a platform now used to probe the relationship between driver and controller and power dynamics.
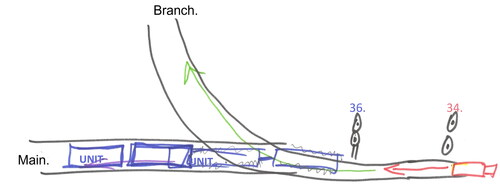
Figure 5. Identified themes conceptualised within an interlaced triquetra, with overlapping arcs illustrating the connectedness between different key themes and subthemes.