
Figures & data
Table 1. Impact on women’s status indices, all aid
Table 2. Impact on women’s status indices, gender aid
Table 3. Extended results
Table 4. Impact in matrilineal areas
Table 5. Impact in patrilineal areas
Figure 1. Intensity of matrilineal tenure.
Notes: The figure plots the geographic distribution of our matrilineal indicator. We base our definition of matrilineal societies on the ethnic identification of individual respondents. Therefore the intensity at the cluster level varies between 0 and 1 representing the share of respondents that identify themselves as belonging to one of the ethnic groups classified as matrilineal.
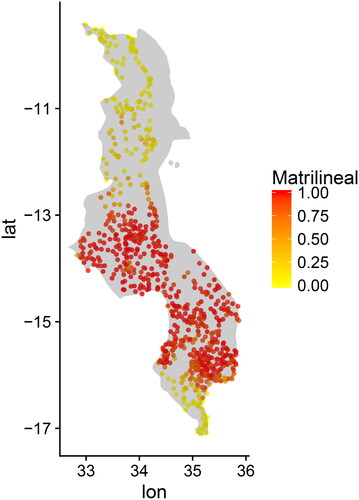
Figure 2. Map of aid projects and survey waves.
Notes: The figure plots the geographic distribution of aid projects and of household clusters in the two DHS waves. The color of the project dot reflects whether the project has or not a specific gender-targeting, while the shape of the household dot reflects the survey wave.
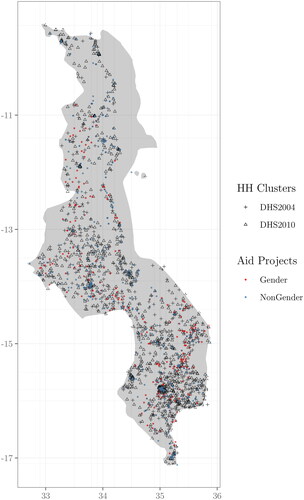
Table A1. Normalized differences, pre-treatment
Table A2. Normalized differences - treatment groups
Table A3. Normalized differences - control groups
Table A4. Pre-trends
Supplemental Material
Download PDF (389.9 KB)Data availability statement
Datasets generated for and analyzed in the current study are available at the Dataverse Project repository, https://doi.org/10.7910/DVN/KTLSQT.