
Figures & data
Figure 1. Percentage of beneficiaries receiving food from the FFP.
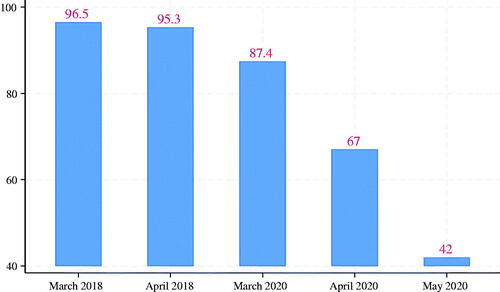
Figure 2. Study timeline.
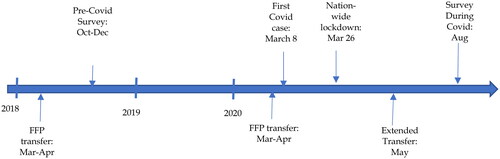
Table 1. Descriptive statistics: Percentage of respondents asked to pay bribe
Table 2. Percentage of households receiving food and its determinants (Estimation of equation 1)
Table 3. Leakage in the FFP—percentage of rice allocated but NOT disbursed-Mean (Standard deviation) [median]
Table 4. Leakage using administrative data on disbursement by district and survey data
Figure A1. Map of Bangladesh Showing the 175 Survey UPZs of Food Friendly Program Survey.
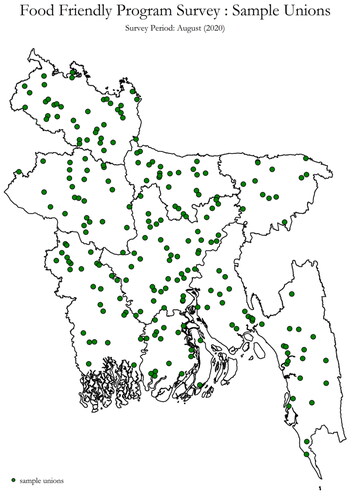
Table A1. Characteristics of households followed up in 2020 relative to the attrited sample in 2020 (households we could not reach)
Supplemental material