
Figures & data
Table 1. Characteristics of the six locations where seed capsules of Metrosideros excelsa were collected in March-April 2022. Samples were collected from only uninfected trees, but presence of infection was recorded nearby.
Figure 1. A, Metrosideros excelsa seed capsules, B, study area within New Zealand (marked as white star), and C, locations sampled in the Auckland region. 1 is Tāwharanui, 2–Wenderholm, 3–Shakespear, 4–Tamaki Drive, 5–University of Auckland, and 6–One Tree Hill. Only mature but unopened seed capsules were collected for determination of seed microbiomes.
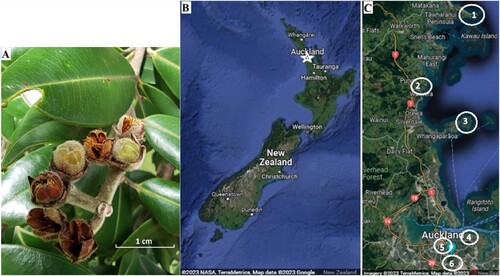
Figure 2. Isolation frequency of the seed-borne bacteria and fungi from individual M. excelsa trees. Error bars indicate standard error of the mean. Isolation frequency was calculated as the number of seed samples containing bacteria or fungi / total number of plated samples. Fungi are represented by blue bars and bacteria by red. Individual trees are marked according to locations: W–Wenderholm, Sh–Shakespear, Tw–Tāwharanui, TD–Tamaki Drive, U–University of Auckland, OTH–One Tree Hill, and W1, W2, W3–trees one, two, three sampled in Wenderholm, respectively.
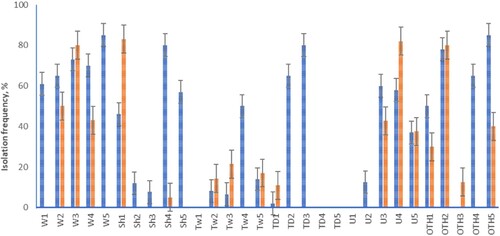
Figure 3. A, Comparison of overall fungal species richness between rural and urban areas, B, isolation rate of fungi, and C, overall isolation rate of microorganisms in each location. Site abbreviations as per .
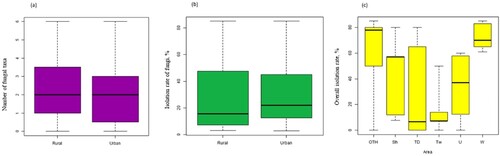
Figure 4. Species richness of the seed-borne fungi and bacteria from individual M. excelsa trees. Error bars indicate standard error of the mean. Fungi are represented by blue bars and bacteria by the red. Site codes as per .
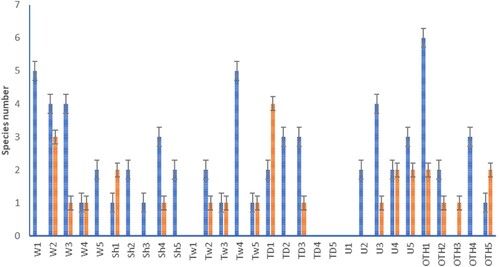
Table 2. Nearest matches of endophytic bacteria isolated from Metrosideros excelsa seeds. Individual trees are marked according to locations: W–Wenderholm, Sh–Shakespear, Tw–Tāwharanui, TD–Tamaki Drive, U–University of Auckland, OTH–One Tree Hill, and W1, W2, W3–trees one, two, three sampled in Wenderholm, respectively. Species identities reflect GenBank IDs based on sequence similarity values.
Table 3. Nearest matches of endophytic fungi isolated from M. excelsa seeds. Individual trees are marked according to locations: W–Wenderholm, Sh–Shakespear, Tw–Tāwharanui, TD–Tamaki Drive, U–University of Auckland, OTH–One Tree Hill, and W1, W2, W3–trees one, two, three sampled in Wenderholm, respectively. Species identities reflect GenBank IDs based on sequence similarity values.
Figure 5. Relative abundance of the frequently isolated fungal endophytes in individual Metrosideros excelsa trees. Each bar represents the whole mycobiome recovered from an individual tree, and relative abundances of the seven most common fungal species were calculated for each tree as a percentage of isolation. Fungal genera isolated from only one tree or with average isolation rate lower than 5% are shown collectively as “others”. Site abbreviations as per .
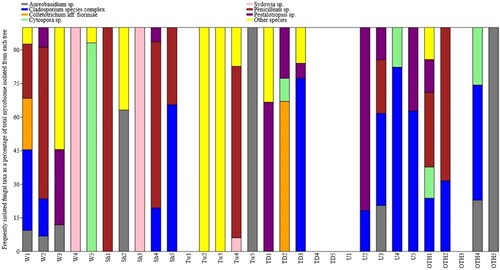
Figure 6. Nonmetric multidimensional scaling ordination of the microbial composition in seeds from individual trees of Metrosideros excelsa based on Bray-Curtis distance metric (stress = 0.13). Each point represents a microbial community recovered from the seeds of one tree. Trees U1, TD4, TD5, Tw1 did not yield culturable microbiomes on media and were removed from the analysis. Urban locations: red triangle; rural locations: green diamond. Site abbreviations as per .
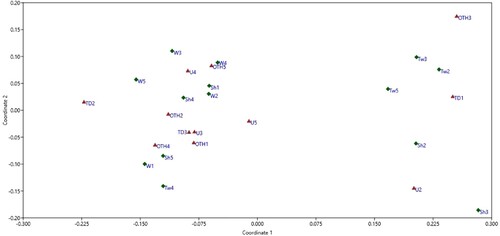
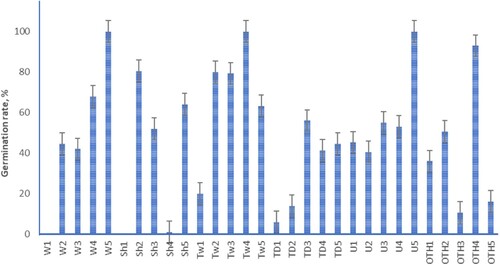
Figure 7. Germination rate of Metrosideros excelsa seeds sampled for their seed microbiome. Error bars indicate standard error of the mean. Site codes as per .