Figures & data
Figure 1 (a) Modal age at death, M, and (b) age-at-death distribution around the mode, D: males in France, 1965–2019 Source: Authors’ analysis of data from HMD (Citation2022).
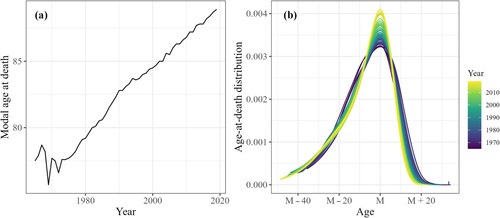
Figure 2 Observed and forecasted model parameters for the (a) modal age at death, M; (b) time index, ; and (c) age pattern,
: males and females in France, 1965–2050
Source: As for .
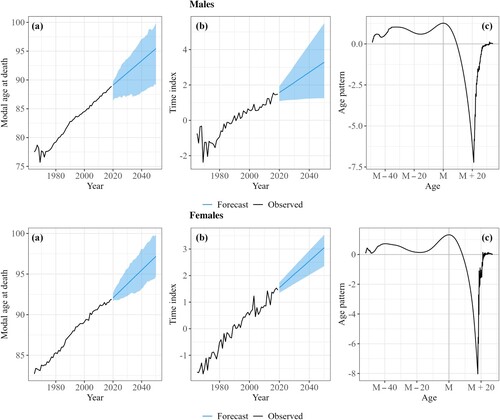
Table 1 Mean forecasting errors across 84 out-of-sample forecasts for life expectancy at age 40 (e40), prediction interval accuracy for life expectancy at age 40, and mean forecasting errors in modal age at death (M), lifespan variation (e†), and weighted logged death rates (In(mx)), from the Mode, STAD, CoDA, FDA, and LC models: males and females in 10 West European countries
Figure 3 (a) Life expectancy at age 40, ; (b) modal age at death, M; and (c) lifespan variation,
, observed and forecasted with the Mode and Lee–Carter models: males and females in France, 1965–2050
Note: The shaded areas represent the 95 per cent prediction intervals.
Source: As for .
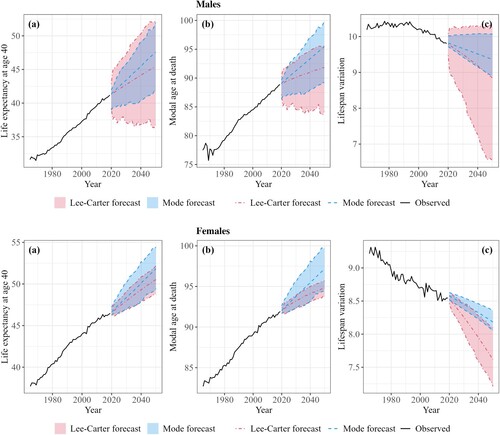
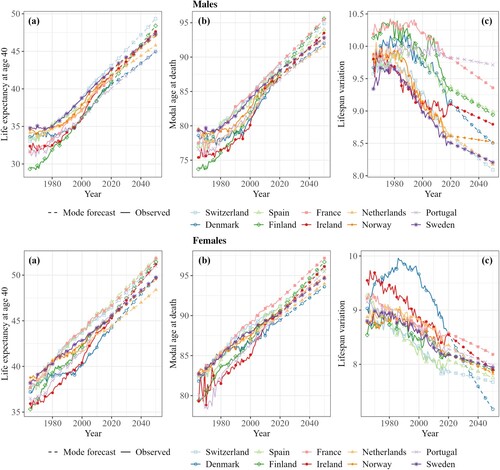
Figure 4 (a) Life expectancy at age 40, ; (b) modal age at death, M; and (c) lifespan variation,
, observed and forecasted with the Mode model: males and females in 10 West European countries, 1965–2050
Note: This figure is best viewed online in colour.
Source: As for .