
Figures & data
Table 1. Demographics and baseline renal function for the study cohort.
Figure 1. The left picture shows a pre-procedural CT with A – Inferior vena cava, B – Left renal vein, C – Liver, D – Right atrium. The right picture shows fluoroscopy during the procedure with A – Inferior vena cava with sampling catheter, B – Right renal vein with contrast injection to verify the correct sampling location.
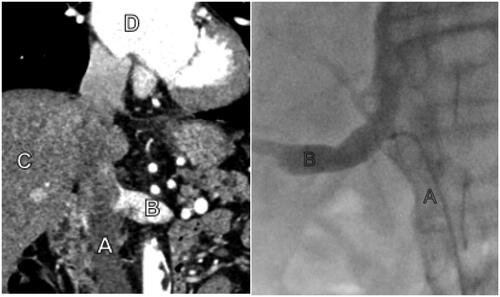
Table 2. Measurement results for analytes.
Figure 2. Renal Elimination Ratio (RER) of 11 measured molecules ordered in size from smallest (left) to largest (right). The X-axis on top gives molecular mass in kDa. β2-MG = β2-microglobulin. Whiskers indicate 95% CI of the mean.
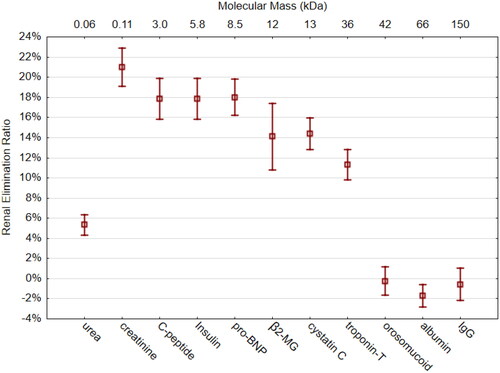
Figure 3. Renal Elimination Ratio (RER, Y-axis) for creatinine vs estimated glomerular filtration rate (eGFR, X-axis) calculated using the CKD-EPI (Chronic Kidney Disease Epidemiology Collaboration) equation. The red line indicates the correlation (r = 0.48, p < 0.001) with 95% CI.
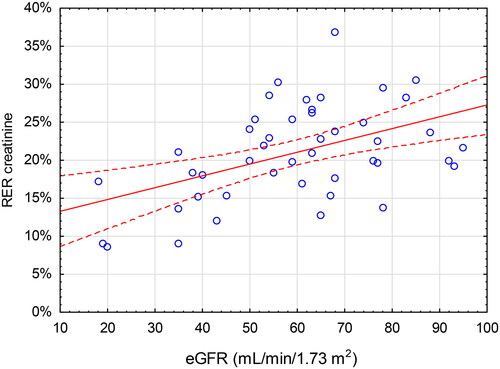
Figure 4. Renal Elimination Ratio (RER, Y-axis) for cystatin C vs estimated glomerular filtration rate (eGFR, X-axis) calculated using the CKD-EPI (Chronic Kidney Disease Epidemiology Collaboration) equation. The red line indicates the correlation (r = 0.40, p = 0.006) with 95% CI.
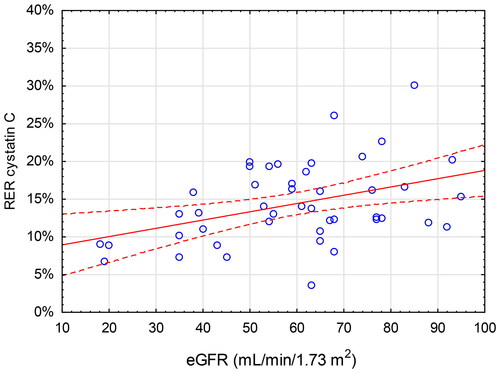
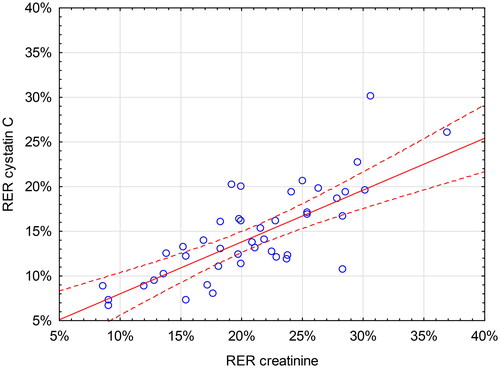
Figure 5. Renal Elimination Ratio (RER, Y-axis) of cystatin C vs Renal elimination ratio (RER, X-axis) of creatinine. The red line indicates the correlation (r = 0.69, p < 0.001) with 95% CI.
Data availability statement
Data will be made available by corresponding author upon reasonable request.