Figures & data
Figure 1. Two degrees of freedom bicycle model.
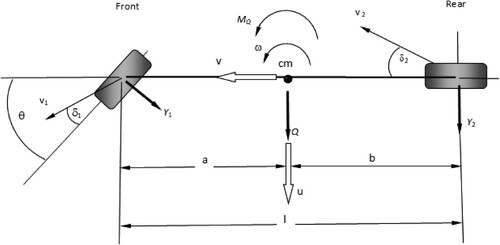
Figure 2. Graphical representation obtained using the Pevsner function for the geometrical analysis of a set of stationary states for the vehicle model described by Equations (1) and (2).
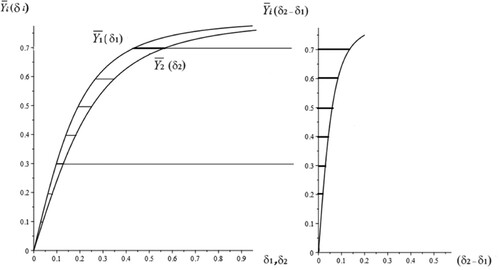
Figure 3. The points of intersection between a moving straight line and a fixed curve indicate a divergent loss of stability in the corresponding multiple stationary regime, i.e. a bifurcation of a fold.
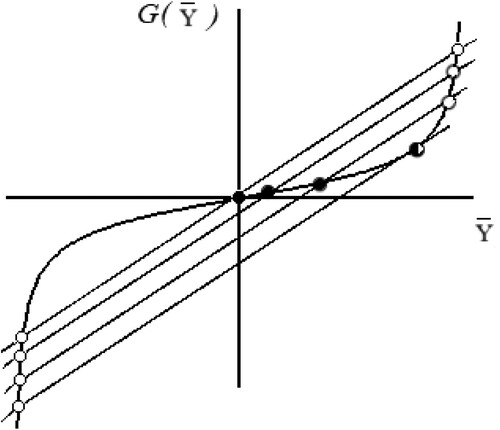
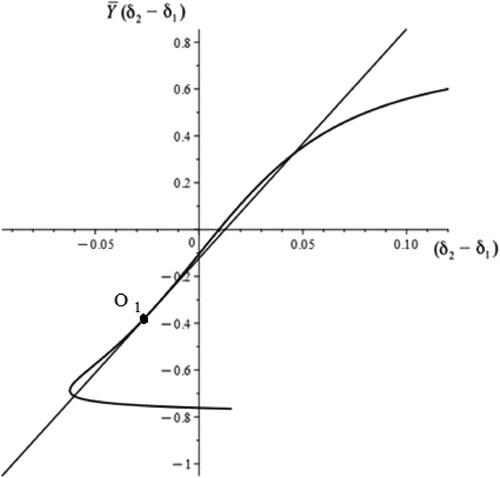
Figure 4. Bifurcation diagram (solid curve) defined by the Equations (23)-(24) and the (dash curve) obtained using the numerical continuation method.
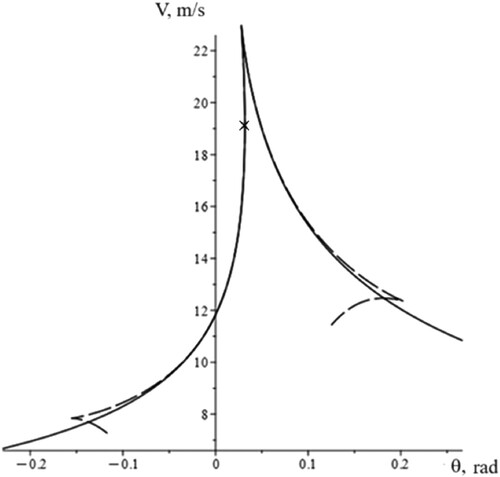
Figure 5. Steering Angle θ as function of time for the realisation of straight-line motion where →
rad.
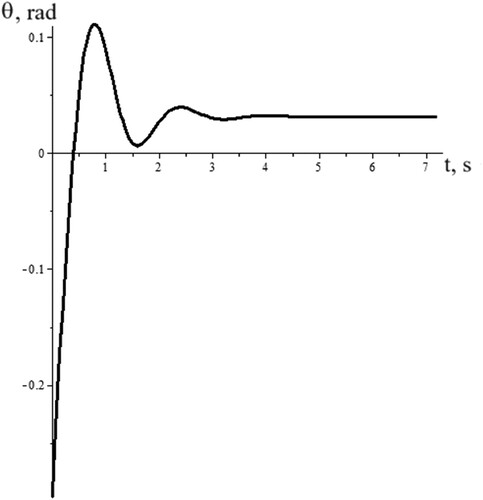
Figure 6. The stabilisation of straight-line motion generated by the steering angle as solved by Equation (33).
Figure 7. Analysis of divergent loss stability on the handling curve (with turning radius of R = 30 m); The long-dash curves are the handling curves and indicate the change in steering angle required for the vehicle to remain on a circlular trajectory of fixed radius if a change in the speed V occurs. The smooth solid curves are the bifurcation sets with the critical values of the control parameters (θ, V) corresponding to a divergent loss in stability for the stationary states of the system: (a) represents q = μ = 0; (b) represents q = 0.3, μ = 0; (c) represents q = 0.3, μ = 0.03.
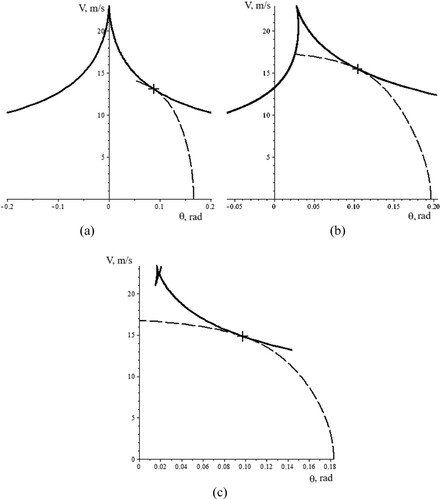
Figure 8. Graphical illustration of corrective steering angles under external lateral force; (a): the condition ,
; (b): the condition
,
; (c) and (d):
,
.
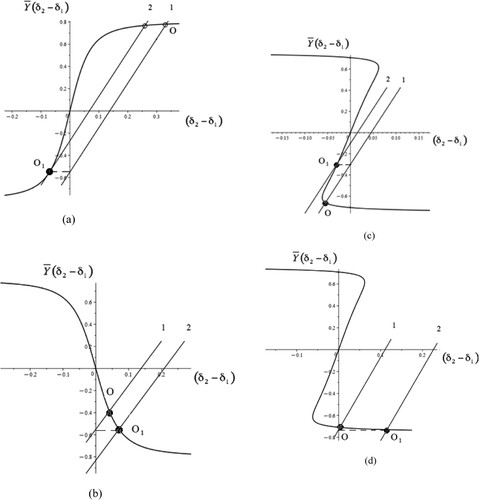
Figure 9. Graph of for different values of parameter μ
.
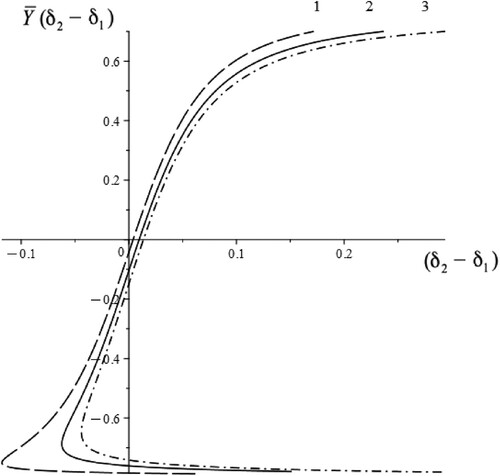
Figure 10. Determination of the corrective steering angle for straight-line motion with a moment of the external force acting about the centre of mass vehicle (μ = 0.0242, q = 0.3, v = 18 m/s).
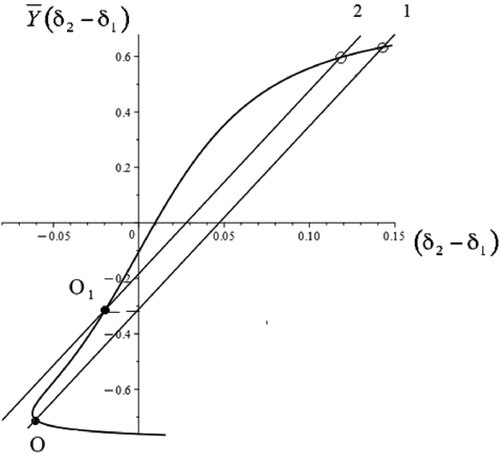
Figure 11. (a): Stability diagram with an additional moment of the external lateral forces acting about a vertical axis at the vehicle of mass centre (μ = 0.0242, q = 0.3); (b): Fragment of stability diagram with an additional moment of the external lateral forces acting about a vertical axis at the vehicle of mass centre (μ = 0.0242, q = 0.3).
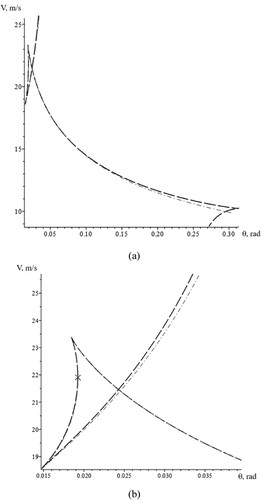
Figure 12. The loss of divergent stability for straight-line vehicle motion (μ = 0.0242, q = 0.3) for critical values of the parameters 0.01928rad,
21.91 m/s.