Figures & data
Table 1. Comparison of data about demographic and during labour between the two groups.
Figure 1. Nomogram of prediction model.a aThe total points were obtained by adding the five factors, including premature rupture of membranes (PROM), foetal abdominal circumference (FAC), prolonged latent phase (PLP) and foetal position and station at the early stage of active phase (FPESAP, FSESAP). It represents predicting the occurrence probability of labour dystocia occurring in the active phase.
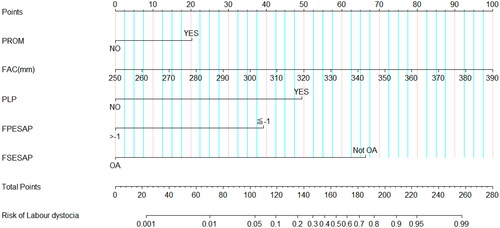
Table 2. Pre-labour and during labour predictors of LD that occurring in the active phase.
Figure 2. ROC of the nomogram.
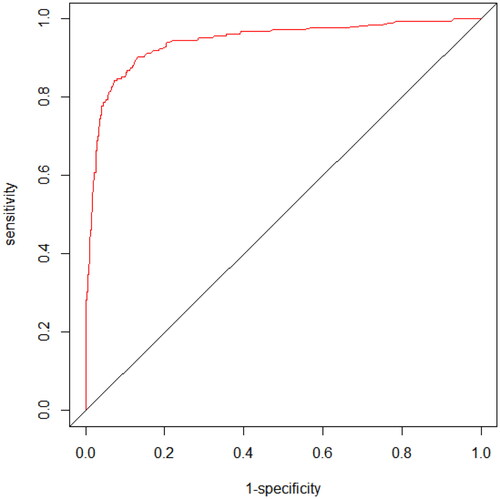
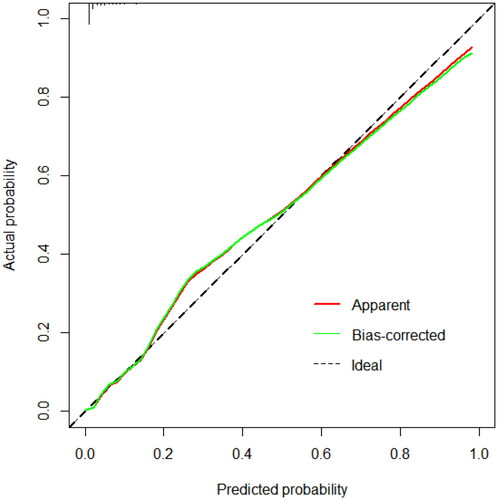
Figure 3. Internal verification calibration diagram of the nomogram.b bThe X- and Y-axis represent the predicted and actual occurrence probability of labour dystocia occurring in the active phase, respectively. The diagonal black dotted line represents the prediction of an ideal model, and the green solid line represents the performance of the nomogram; the closer the green line is to the diagonal black dotted line, the better is the prediction performance.