

Figures & data
Table 1. RNA-seq data summary.
Figure 1. (A–D) Volcano plots showing the differentially expressed lncRNAs. (F) Venn diagram of the overlap number of DElncRNAs. (E, G) Histogram of differentially expressed known lncRNAs. DElncRNAs were defined as the lncRNAs with significant (q≤ 0.05) differential expression upon Roxadustat (RXD) and dimethyloxalylglycine (DMOG) treatment, when compared with the control groups (Liver_PBS group or Retina_PBS group).
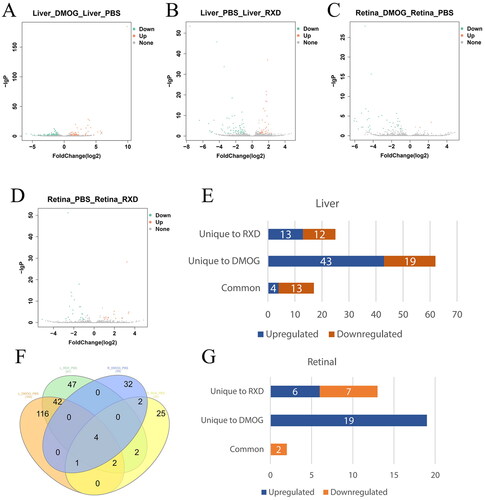
Table 2. The numbers of known differentially expressed lncRNAs.
Figure 2. Function enrichment results of the target genes of DElncRNAs. (A) Top 10 enrichment KEGG pathways of target genes of DElncRNAs between liver DMOG treatment samples and liver PBS treatment samples. (B) Top 10 enrichment KEGG pathways of target genes of DElncRNAs between liver RXD treatment samples and liver PBS treatment samples. (C) Heatmap of enrichment q-value value of GO terms (biological processes). (D) Heatmap of enrichment FDR value of GO terms (cellular component GO terms).
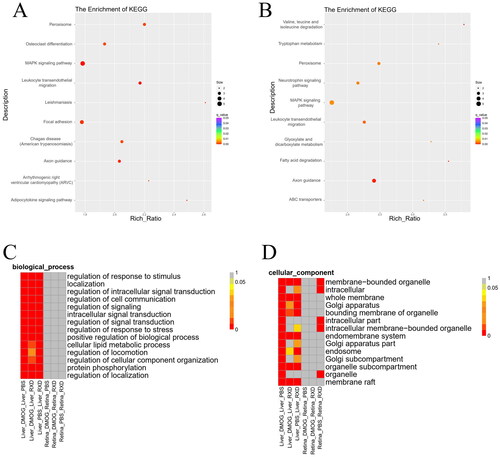
Table 3. The numbers of GO terms and KEGG pathways of the target genes of differentially expressed lncRNAs.
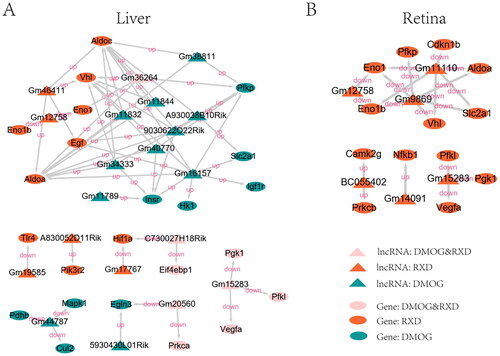
Figure 3. The interaction network of DElncRNAs and the target genes in the HIF-1 pathway. (A) In the liver; (B) in the retina. Genes involved in the HIF-1 signalling pathway of Mus musculus (mmu04066) were downloaded from the KEGG PATHWAY Database. The cis-acting regulatory genes or the trans-acting regulatory genes of DElncRNAs were defined as the target genes.
Supplemental Material
Download Zip (2.1 MB)Data availability statement
The data were downloaded from the Gene Expression Omnibus (GEO) database, www.ncbi.nlm.nih.gov/geo (accession no. GSE74170; NCBI tracking system no. 17567121).