

Figures & data
Figure 1. Composition classification and abundance comparison of vaginal microbiota.
Comparison of vaginal microbiota at the levels of phylum (A), class (B), order (C), family (D), genus (E) and species (F) in the cervical Cancer group, Control group, high-grade cervical intraepithelial neoplasia (CIN) group (High group) and low-grade CIN (Low group).
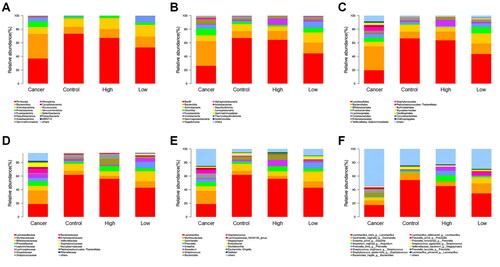
Figure 2. Violin plot of operational taxonomic unit diversity index for inter-group comparison.
A: The chao1 estimator was used to evaluate the index of the number of operational taxonomic units (OTUs) contained in each group of samples, i.e., the total number of species; B: The detection probability of microbial sequences in each group of samples in this sequencing was shown by goods_coverage index; C: The number of microbiota contained in each group of samples was indicated by observed_species index, and the higher numerical value indicated the richer microbial abundance of samples; D: The phylogenetic relationship of species within the microbial community was signalled by PD_whole_tree index; E: The Shannon index was applied to estimate the microbial diversity and evenness in each group of samples. A higher index indicated a better evenness; F: The Simpson index was adopted to evaluate the microbial diversity in each group of samples, and the higher index indicated richer species diversity of samples and vice versa. The X-axis was the grouping; Cancer, cervical cancer; Control group, patients with negative LCT and HPV tests; High group, high-grade cervical intraepithelial neoplasia (CIN). Low group, low-grade CIN. The Y-axis is the diversity index value.
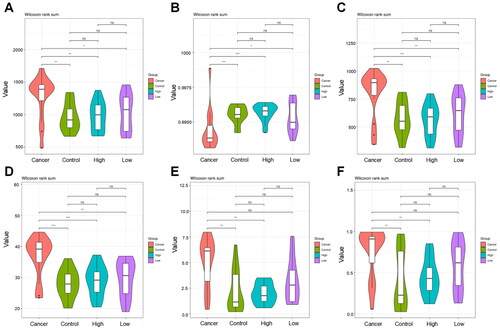
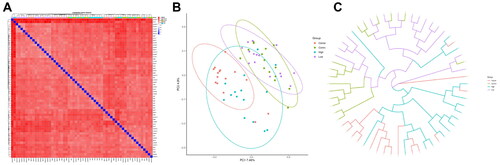
Figure 3. β diversity analysis of biomes of the cervical Cancer group, Control group, high-grade cervical intraepithelial neoplasia (CIN) group (High group) and low-grade CIN (Low group).
A: Sample distance heat map. Deeper blue colour indicated closer distance between samples, while higher similarity and deeper red colour indicated further distance; B: PCA analysis scatter diagram, abscissa (PC1) and ordinate (PC2) were the two main coordinates with the largest explanation of the difference between samples. The same colour represented the same group, a point indicated a sample, and similar samples would gather together; C: UPGMA hierarchical clustering tree between samples, closer branch distance suggested more similar samples.
Supplemental Material
Download Zip (1.1 MB)Data availability statement
The data used to support the findings of this study are available from the corresponding author upon request.