

Figures & data
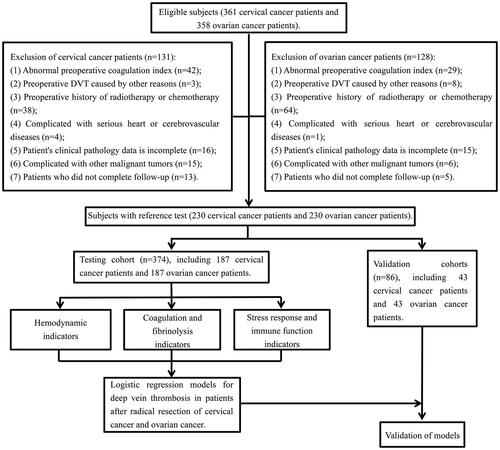
Table 1. Comparison of patients’ general clinical indicators and surgery-related indicators. (Data were represented as the Mean ± standard deviation (SD) or median [interquartile range, (IQR)] or percentage).
Figure 1. The technical route of this study.

Table 2. Comparison of changes of thromboelastography, coagulation, stress response, and immune function indicators at different time points before and after operation in the testing cohort (n = 374). (Data were represented as the Mean ± standard deviation (SD)).
Table 3. The calculated performance values for different indicators in the testing cohort.
Figure 2. ROC analysis of coagulation, thromboelastography, stress response, and immune function laboratory indicators to predict the occurrence of DVT after radical resection of cervical cancer and ovarian cancer in the testing cohort. (A) Radical resection of cervical cancer (n = 187). (B) Radical resection of ovarian cancer (n = 187). ROC: receiver operator characteristic; DVT: deep venous thrombosis.

Figure 3. Validation of the logistic regression models in the validation cohort. (A) Comparison of the incidence of DVT between the group of estimated probability ≥0.806 and the group of estimated probability <0.806 in the radical resection of cervical cancer group. (B) Comparison of the incidence of DVT between the group of estimated probability ≥0.697 and the group of estimated probability <0.697 in the radical resection of ovarian cancer group. DVT: deep venous thrombosis.

Supplemental Material
Download Zip (474.6 KB)Data availability statement
Data available within the article.