

Figures & data
Table 1. Primers and probes of qPCR.
Figure 1. The standard curves of RASSF1A.
Plot of the input target cell ntunbers (natural logaritlun) against the threshold cycle (Ct) of RASSF1A. Linear function is y = -0.7139 * x + 27. 891. The correlation coefficient is 0.9981.
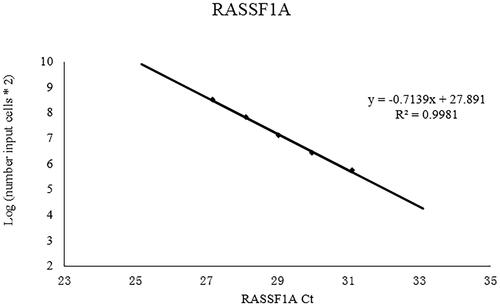
Table 2. Quantitation of the foetal cells in IUL samples.
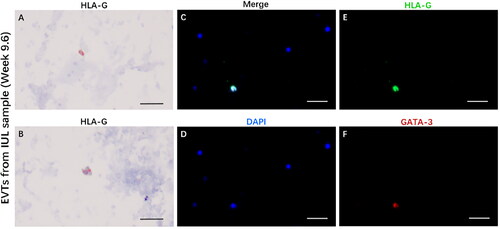
Figure 2. EVTs express HLA-G and GATA-3 in IUL samples.
(A, B) HLA-G immunohistochemical staining in EVTs from IUL sample at gestational week 9.6. (C) The immunofluorescence merge figure of EVTs from IUL sample at gestational week 9.6. (D) DAPI staining for nucleus. (E) HLA-G and (F) GATA-3. Magnification: 100X, scale bar = 50 µm.
Supplemental Material
Download MS Word (18.2 KB)Data availability statement
The data that support the findings of this study are available on doi: 10.6084/m9.figshare.23633739