

Figures & data
Figure 1. Flow diagram according to PRISMA (preferred reporting items for systematic review and meta-analysis) 2020. CINAHL, Cumulative Index to Nursing and Allied Health Literature.
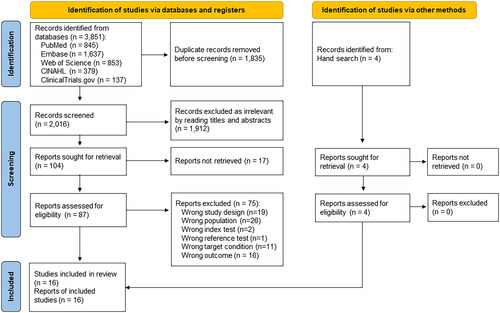
Table 1. Characteristics of included studies.
Figure 2. Risk of bias and applicability concerns summary: review authors’ judgements about each domain for each study (A) and presented for each domain as percentages across all studies (B). Note: The numbers on the bar for each domain represent the number of studies scored as high, unclear or low risk of bias or applicability.
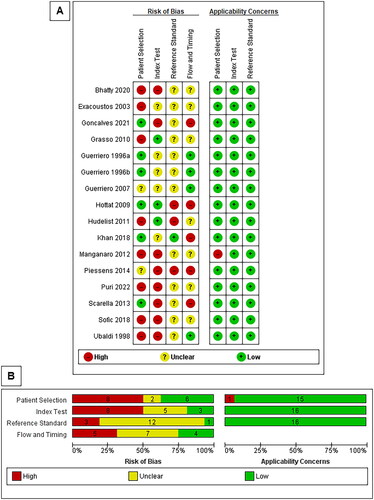
Figure 3. Forest plot exhibiting study‐specific estimates and pooled sensitivity and specificity for TVUS (A) and MRI (B) in diagnosing ovarian endometriosis. TP, true positive; FP, false positive; FN, false negative; TN, true negative; CI, confidence interval. Notes: Studies are presented for TVUS and MRI and are ordered according to the year of publication. Summary or pooled values for sensitivity and specificity are represented by polygons (black dashed vertical lines mark the point estimates for sensitivity and specificity) and study-specific estimates of sensitivity and specificity are represented by squares with 95% confidence intervals (black solid horizontal lines).
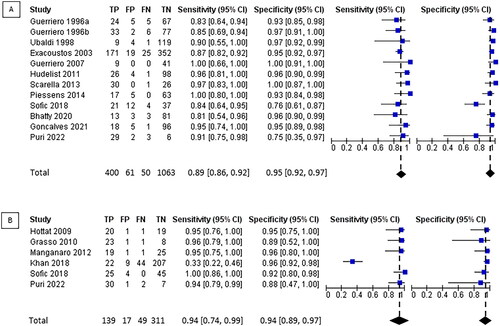
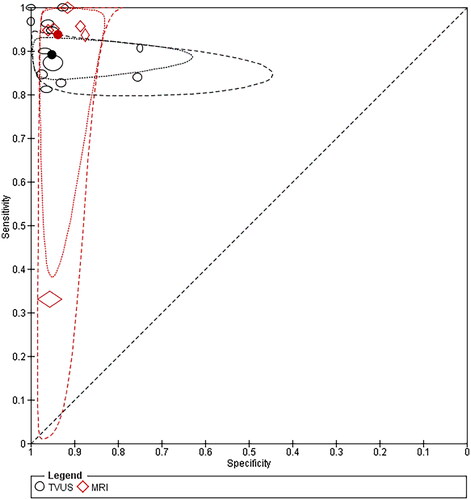
Figure 4. Summary receiver operating characteristic plot of TVUS and MRI for detection of ovarian endometriosis. TVUS, transvaginal ultrasound; MRI, magnetic resonance imaging. Notes: The markers for each test on the summary receiver operating characteristic plots represent pairs of sensitivity and specificity from the included studies. The size of each marker was scaled based on the sensitivity and specificity of the study. The solid circles (summary points) represent the summary (pooled) estimates of the sensitivity and specificity for each test. Each summary point is surrounded by a dotted line representing the 95% confidence region and a dashed line representing the 95% prediction region (the region within which it is 95% certain that the results of a new study will lie).
Supplemental Material
Download PDF (922.2 KB)Data availability statement
The authors confirm that data supporting the findings of this study are available within the article and its supplementary materials.