

Figures & data
Table 1. Homo gene primers for reverse transcription PCR.
Figure 1. Normal stromal cells (NSCs) inhibit the growth of Ishikawa cells but not that of eutopic stromal cells (EuSCs) and ectopic stromal cells (EcSCs) (EdU A and B, CCK-8 C). NSCs exert a suppressive effect on Ishikawa cell proliferation compared to the controls; however, the effect of EcSCs and EuSCs was not significantly different from that of the control (p > .05). Scale bar: 50 μm. Values are mean ± SD (n = 3; ns, not significantly different; *, p < .05; ****, p < .0001).
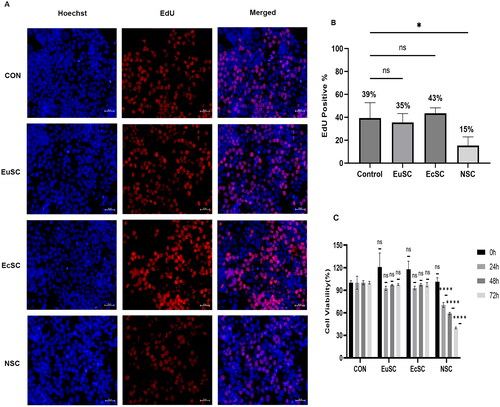
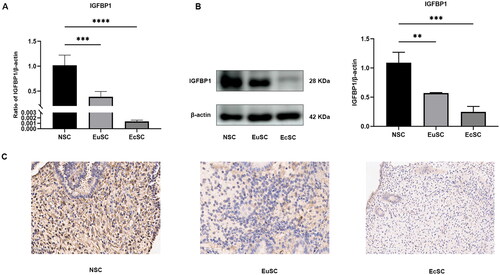
Figure 2. IGFBP1 expression in EuSCs and EcSCs of patients with endometriosis was downregulated. (A) IGFBP1 levels in EuSCs and EcSCs were lower than those in NSCs, as determined using RT-qPCR. (B) IGFBP1 levels in EuSCs and EcSCs were lower than those in NSCs, as determined using western blotting. Values are mean ± SD (n = 3; **, p < .01; ***, p < .001; ****, p < .0001). (C) Immunohistochemistry of IGFBP1 expression in both EuSCs and EcSCs.
Supplemental Material
Download Zip (18.9 MB)Data availability statement
Data will be made available on request.