

Figures & data
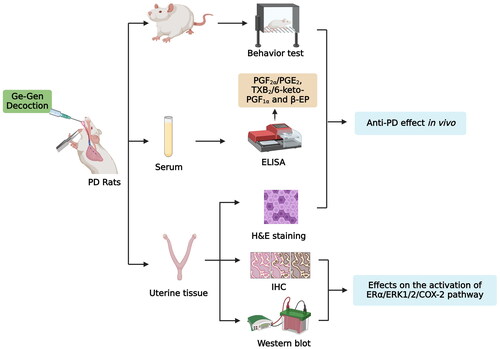
Figure 1. A flow chart of this study. SD: Sprague Dawley; PD: Primary dysmenorrhoea; GGD: Ge-Gen decoction; IBF: Ibuprofen; H&E: Haemotoxylin and Eosin; ELISA: Enzyme-linked immunosorbent assay; IHC: Immunohistochemistry; WB: Western blot; PGE2: Prostaglandin E2; PGF2α: Prostaglandin F2 alpha; ERα: Oestrogen receptor alpha; ERK1/2: Extracellular signal-regulated protein kinases 1 and 2; COX-2: Cyclooxygenase-2.
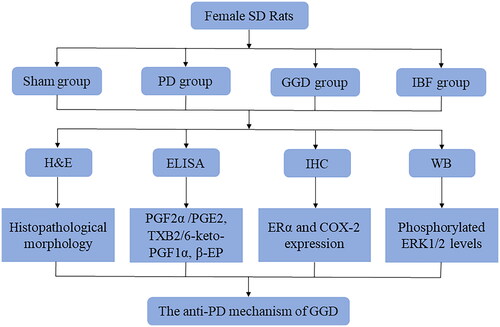
Figure 2. The anti-PD effects of GGD on PD model rat. (A) The weight of the rat on day 1 of the experiment. (B) The weight of the rat on day 10. (C–E) The writhing numbers (C), uterine index (D), and pathological changes in the uterine tissue (E) in each group, as determined using H&E staining, scale bar = 50 µM. The black arrow represents the lesion. Data are presented as mean ± SD (n = 6). **, p < 0.01 vs. Sham group, ##, p < 0.01 vs. GGD group (Tukey–Kramer’s test). PD: Primary dysmenorrhoea; GGD: Ge-Gen decoction; IBF: Ibuprofen.
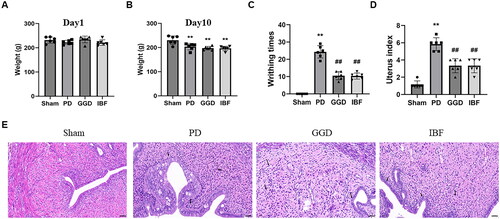
Figure 3. Effect of GGD on COX-2 expression and serum biochemical indexes. (A) The protein levels of COX-2 in the uterine tissue of each group, as determined using IHC, scale bar = 20 µM. (B) The ratio of PGF2α/PGE2 and TXB2/6-keto-PGF1α and β-EP content in the serum of rats determined using corresponding ELISA kits. Data are presented as mean ± SD (n = 6). **, p < 0.01 vs. Sham group, ##, p < 0.01 vs. GGD group (Tukey–Kramer’s test). PD: Primary dysmenorrhoea; GGD: Ge-Gen decoction; IBF: Ibuprofen; β-EP: β-endorphin; TXB2, thromboxane B2; 6-keto-PGF1α: 6-keto-prostaglandin F1α; ELISA: Enzyme-linked immunoabsorbent assay.
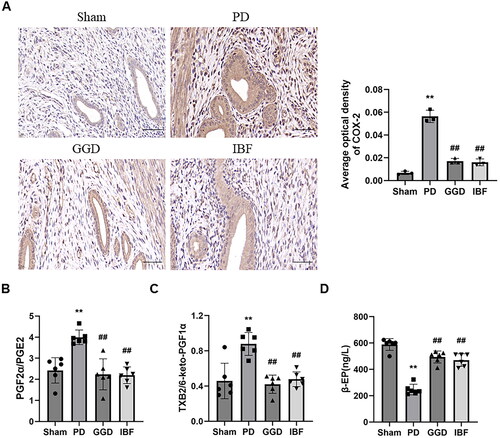
Figure 4. Effect of GGD on the activation of ERK1/2 signalling. The protein levels of phosphorylated ERK1/2 and total ERK1/2 in the uterine tissue of each group were measured with western blotting. Data are presented as mean ± SD (n = 3). **, p < 0.01 vs. Sham group, ##, p < 0.01 vs. GGD group (Tukey–Kramer’s test). PD: Primary dysmenorrhoea; GGD: Ge-Gen decoction; IBF: Ibuprofen.
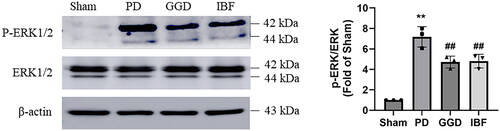
Figure 5. Effect of GGD on ERα expression. The protein level of ERα in the uterine tissue of each group, as measured with western blotting (A) and IHC (B). scale bar = 20 µM. Data are presented as mean ± SD (n = 3–4). **, p < 0.01 vs. Sham group, ##, p < 0.01 vs. GGD group (Tukey–Kramer’s test). PD: Primary dysmenorrhoea; GGD: Ge-Gen decoction; IBF: Ibuprofen.
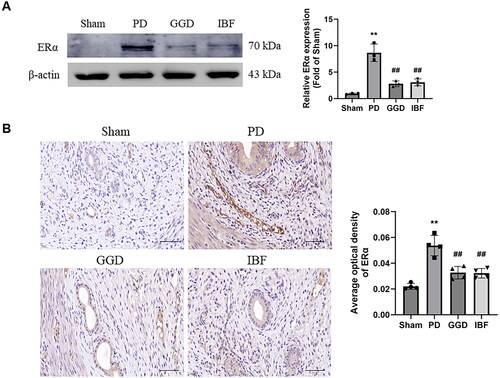
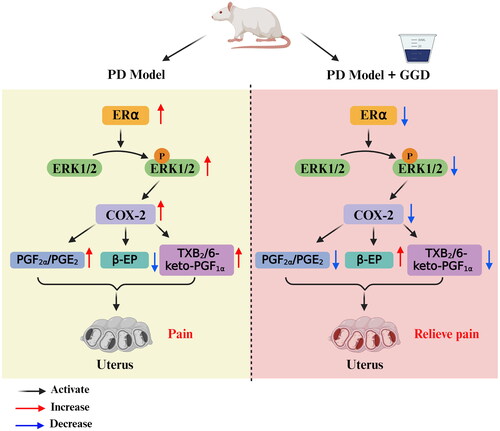
Figure 6. Schematic summary illustration. GGD alleviates PD in rats by suppressing the COX-2-mediated release of PGE2 and PGF2α, modulating the ERα/ERK1/2/COX-2 pathway, and increasing β-EP content. PD: Primary dysmenorrhoea; GGD: Ge-Gen decoction; PGE2: Prostaglandin E2; PGF2α: Prostaglandin F2 alpha; ERα: Oestrogen receptor alpha; ERK1/2: Extracellular signal-regulated protein kinases 1 and 2; COX-2: Cyclooxygenase-2, β-EP: β-endorphin; TXB2, thromboxane B2; 6-keto-PGF1α: 6-keto-prostaglandin F1α.
Data availability statement
The data supporting the findings of this study are available from the corresponding author upon reasonable request.