
Figures & data
Table 1. Search strategy.
Figure 1. Simulation model’s stages, activities, and data sources.
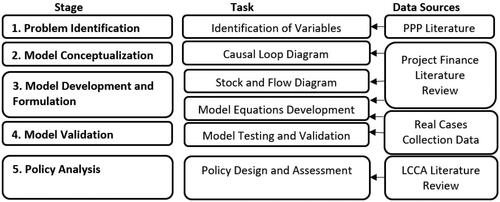
Table 2. Exogeneous parameters.
Figure 2. CLD.
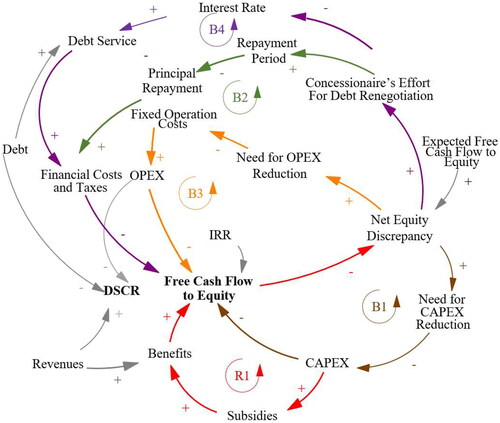
Figure 3. SFD.
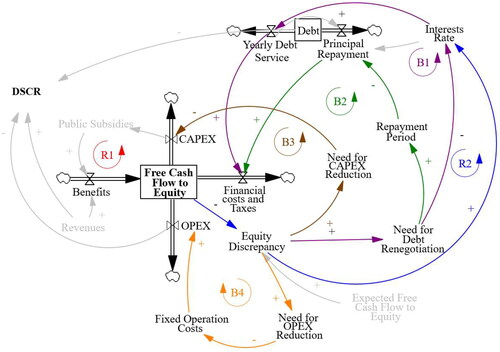
Figure 4. Behavior reproduction test for the baseline scenario. (i) Project 1; (ii) Project 2.
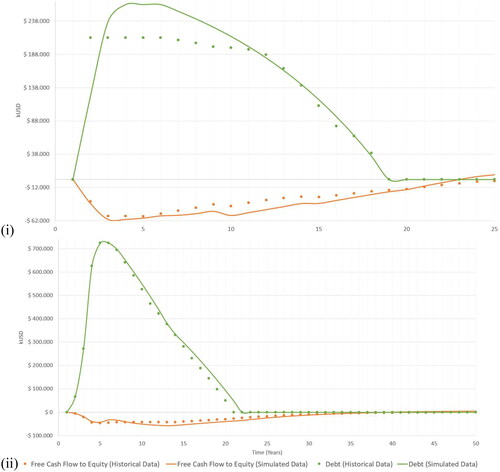
Table 3. Description of concessionaire’s interventions.
Figure 5. Impact of concessionaire’s interventions on the model’s feedback structure.
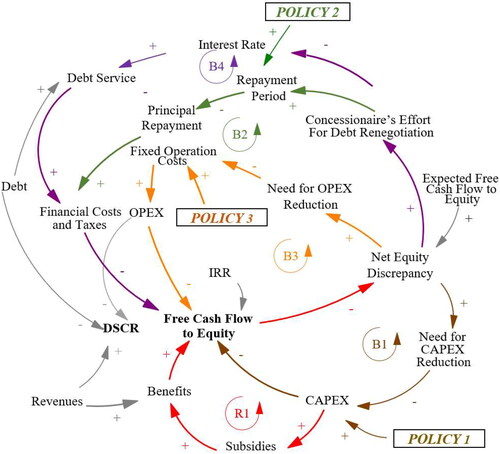
Figure 6. Effect of concessionaire’s interventions on outcomes. (a) Cash Flow to Equity Project 1. (b) Cash Flow to Equity Project 2. (c) DSCR Project 1. (d) DSCR Project 2.
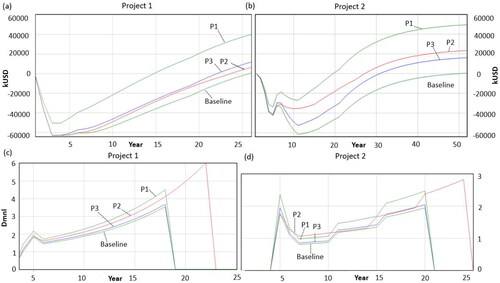
Figure 7. Results baseline vs. scenarios on the free cash flow to equity for project 1 (a) and Project 2 (b).
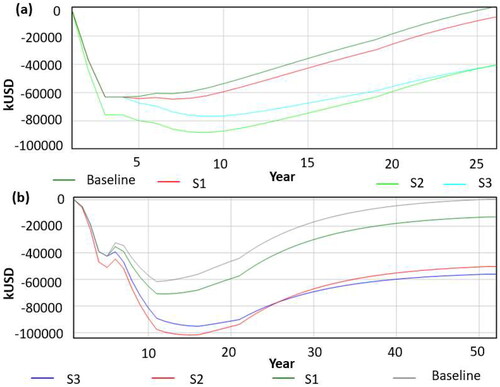
Figure 8. Results baseline vs. scenarios on the DSCR for project 1 (a) and project 2 (b).
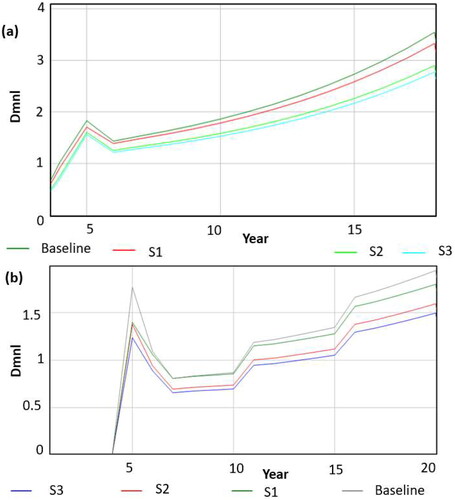
Table 4. Simulation results for the scenarios.
Figure 9. Effect of interventions on the free cash flow to equity for: (a) Scenario 1- Project 1. (b) Scenario1- Project 2. (c) Scenario 2- Project 1. (d) Scenario 2- Project 2. (e) Scenario 3- Project 1. (f) Scenario3- Project 2.
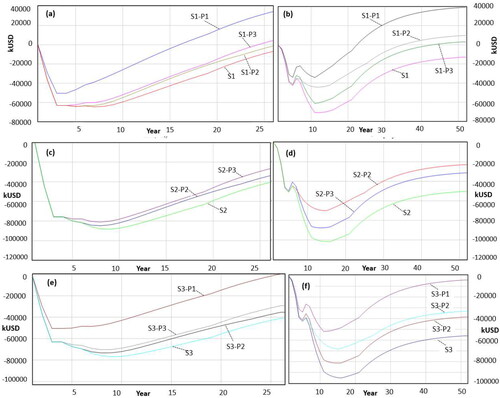
Figure 10. Effect of interventions on the DSCR for: (a) Scenario 1 -– Project 1. (b) Scenario 1 -– Project 2. (c)Scenario2- Project 1. (d) Scenario 2- Project 2. (e) Scenario 3- Project 1. (f) Scenario3- Project 2.
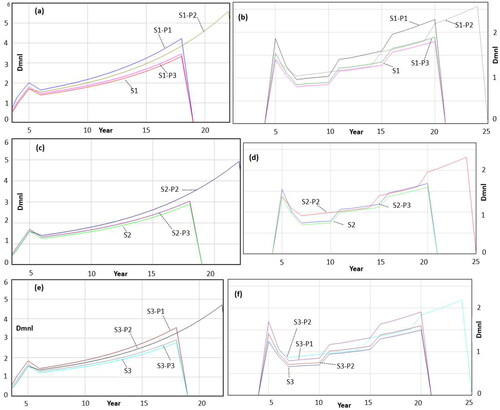
Table 5. Description of concessionaire’s interventions.
Data availability statement
Data generated or analyzed during the study are available from the corresponding authors by request.