
Figures & data
Table 1. List of Australian bird extinctions and possible extinctions, derived from Garnett and Baker (Citation2021).
Figure 1. Upper panel: The former range of bird species and subspecies that have become extinct in Australia. The small distribution of the Western Rufous Bristlebird overlaps with that of the Western Australian Lewin’s Rail, and is therefore highlighted with a red arrow. Small islands are shown with a shaded dot to enhance visibility. Two possible extinctions, Tiwi Hooded Robin and Cape Range Rufous Grasswren are shaded yellow, and the distribution of the latter is further highlighted with a grey-yellow arrow. Lower panel: The timing of Australian bird extinctions (darker boxes indicate species; lighter boxes subspecies; yellow boxes the two possible extinctions).
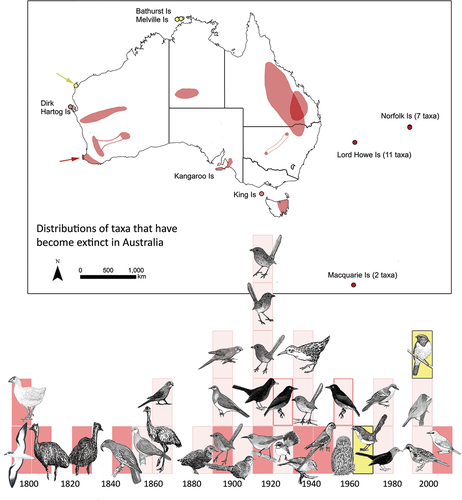
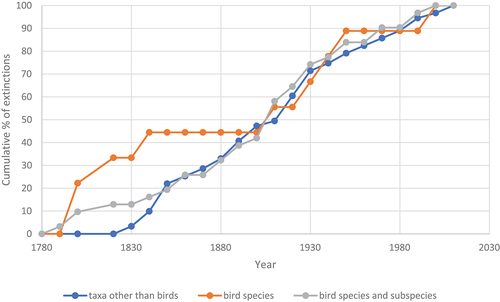
Figure 2. Cumulative percentage of extinctions across decades for Australian bird species (brown: N = 9), Australian bird taxa (grey: N = 31), and Australian plant and animal species other than birds (blue: N = 91), with each expressed as a percentage of the total number of extinctions of that group over the period 1780–2022. Dating of non-bird extinctions is derived from Woinarski et al. (Citation2019).
Data availability statement
All data used in this paper are in the public domain in fully-cited documents.