Figures & data
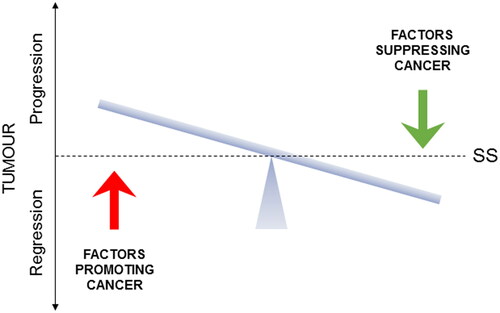
Figure 1. Effects of a dietary compound on PDAC: Resveratrol. For all parts of the figure (A to C), treatments were as follows: control (Citation1), resveratrol (Citation2), gemcitabine (Citation3) and their combination (Citation4). A. In vitro effects on growth (quantified as colony number) of treating two different human PDAC cell lines (MiaPaCa-2/gray bars and Panc-1/black bars) with resveratrol, gemcitabine and their combination. For both cell lines, the inhibition of growth was significantly greater for the combination than gemcitabine alone (P < 0.01). From Zhou, C et al. (Citation27). B. In vivo growth of MiaPaCa-2 cells in an orthotopic xenograft model of PDAC. The inhibition of growth was significantly greater for the combination than gemcitabine alone (P < 0.001). Modified from Harikumar et al. (Citation32). C. Assessment of stemness in PDAC cells obtained from tissue sections of KPC mice. Stemness was quantified as the Sox2-positive area, expressed as a percentage of total. Resveratrol significantly reduced the effect of gemcitabine in inducing stemness (P < 0.001), bringing it to control level. Dotted horizontal line denotes the median control level, as reference. From Zhou, C. et al. (Citation27).
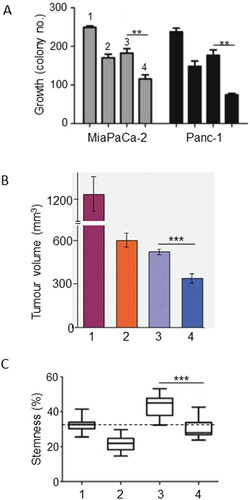
Table 1. Dietary and nutraceutical agents with emerging anti-PDAC effects.
Figure 2. Effects of a dietary compound on PDAC: Epigallocatechin gallate. A. Apoptotic responses of Panc-1 cells to treatment with increasing concentrations of epigallocatechin gallate (EGCG) and combination with a fixed dose of gemcitabine (GEM). The histobars denote the following: GEM alone (Citation1), GEM + EGCG (2-4, increasing concentrations of EGCG). Data represent mean ± SD. There was a statistically significant difference between the effects of all the combinations compared with GEM alone (P < 0.05). From Tang et al. (Citation50). B. Effects of GEM, EGCG and their combination on the invasiveness on two pancreatic cancer cell lines, Panc-1 (black histobars) and MiaPaCa-2 (gray histobars). Data represent mean ± SD. Effects of the treatments are expressed as a percentage of control (Cont). For both cell lines, the effect of the combination was significantly greater than GEM alone (P < 0.01). From Wei, R. et al. (Citation51). C. Effect of GEM, EGCG and their combination on tumorigenesis in a subcutaneous xenograft model of PDAC (KPC cells). “Cont” denotes control data from untreated animals. Data represent mean ± SD. The decrease in tumor weight induced by the combination was greater than GEM alone (P < 0.05). From Wei, R. et al. (Citation52).
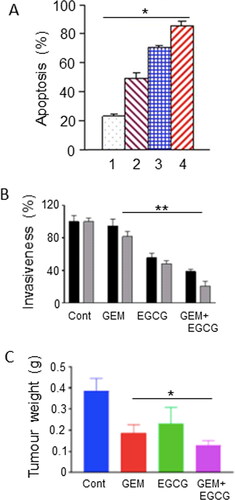
Figure 3. Effects of a dietary compound on PDAC: Vitamin B9. Meta-analysis of studies examining the effects of folate levels (assessed from dietary intake, blood levels and supplements) on pancreatic cancer risk. Diamonds indicate the average and the spread of the data. White diamonds relate to the individual data sets. Black diamond indicates overall significantly reduced relative risk, despite the noticeable variability across the three sets of studies. Modified from Lin, H. et al. (Citation53), where further details and primary data can be found.
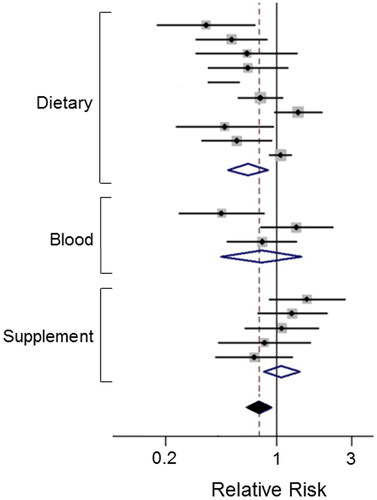
Figure 4. Effects of a dietary compound on PDAC: Capsaicin. A. Effects on tumorigenesis of treatment with gemcitabine coupled with capsaicin (CAPS) and resveratrol (RES) combined in a xenograft (Capan-2) model of pancreatic cancer. Tumorigenesis was quantified as tumor weight expressed relative to control. The treatments were as follows: control (Citation1), high-dose GEM (Citation2), high-dose GEM coupled with CAPS and RES combination (Citation3), low-dose GEM (Citation4), and low-dose GEM coupled with CAPS and RES combination (Citation5). There was no added effect of treatment with high-dose GEM combined with CAPS + RES, suggesting a saturating effect of the chemotherapy (3 vs. 2). Although low-dose GEM had no effect on tumorigenesis (Citation4), combination with CAPS + RES produced a marked inhibitory effect (5 vs. 4, statistics not specified). Dotted horizontal line indicates null effect. Modified from Vendrely et al. (Citation37), where further details can be found. B. Tumorigenesis in a xenograft (Capan-2) model of pancreatic cancer. The treatments were as follows: control (Citation1), 2 Gy radiotherapy (Citation2), and radiotherapy with CAPS + RES (Citation3). Data are presented as mean ± SEM. The effect of the radiotherapy in suppressing tumorigenesis was potentiated significantly by combination with CAPS + RES (3 vs. 2; P < 0.05). From Vendrely et al. (Citation36), where further details can be found.
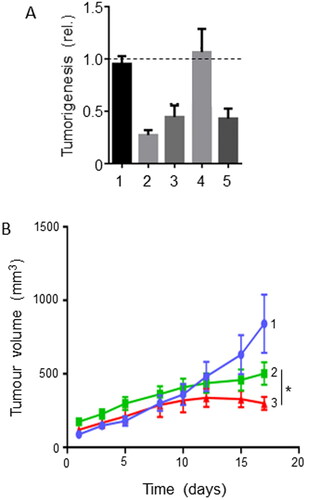
Figure 5. Effects of a dietary compound on PDAC: Quercetin. A. Cell viability of MiaPaCa-2 cells following treatment with increasing concentrations of quercetin (QUER) and gemcitabine (GEM). Cells were pretreated with quercetin at various concentrations for 24 h, and then treated with a fixed concentration of gemcitabine for 72 h. The effects of the combinations with 25 and 50 µM QUER were inferred to be significantly greater than GEM alone (P < 0.05). From Lan et al. (Citation62). B. PANC-1 cell apoptosis. Effects of QUER and GEM, and their combination, on compared with control (Cont). Apoptosis was defined as the number of apoptotic cells expressed as a percentage of control. Modified from Lee et al. (Citation63). C. Effects of treatment with increasing QUER concentrations on mRNA expression of EMT markers (E-cadherin, N-cadherin, and Vimentin) in PATU-8988 cells. Quercetin treatment resulted in dose-dependent reductions in expression of all three mRNAs. In all conditions and concentrations, treatment with quercetin was significant compared with the control (P < 0.05). From Yu et al. (Citation64). D. Invasiveness (quantified arbitrarily as the number of invaded cells per field of view) in PATU-8988 cells treated with increasing concentrations of QUER. For all concentrations, treatment with quercetin produced a significantly greater reduction in invasiveness compared with the control (P < 0.05). From Yu et al. (Citation64). E. Apoptosis (measured by annexin-V FITC) in gemcitabine-resistant MiaPaCa-2 cells. Cells were treated with QUER, GEM or their combination, compared with untreated Cont. The effect of the combination was markedly greater than gemcitabine alone (statistics not performed). From Lan et al. (Citation62). F. Tumor volume in a xenograft model of human primary PDAC cells. AsanPaCa cells were implanted into chick embryos and left untreated (Cont) or treated with QUER. In a parallel experiment, the cells were processed so as to silence miR-let-7c (miR2), or its negative control (miR1). MiR2 and QUER treatment decreased tumor volume significantly compared to the relative controls (P < 0.01). From Nwaeburu et al. (Citation65).
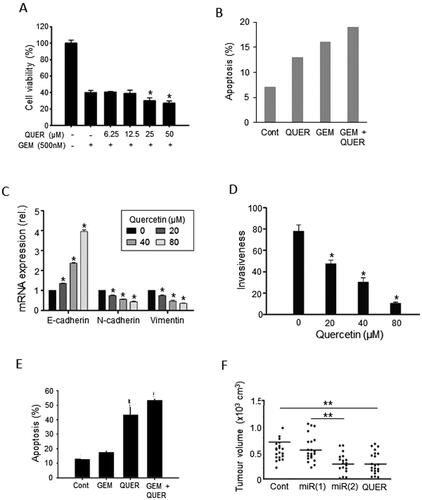
Figure 6. Effects of a dietary compound on PDAC: Sulforaphane. A. Kaplan-Meier analysis of cumulative survival of PDAC patients (undergoing palliative chemotherapy). Patients were treated with a sulforaphane preparation (n = 29, solid line) compared with placebo (n = 11, dotted line). Plus signs indicate patients who were lost to follow-up. The shaded areas denote 95% confidence intervals (dark gray for treatment, light gray for placebo). From Lozanovski et al. (Citation73). B. Effects of 72-hour pretreatment of pancreatic CSC-like cells with sulforaphane (SFN), gemcitabine (GEM) and their combination on volume of tumors formed by subsequent injection (subcutaneous) into nude mice. Time indicated is from the day of inoculation. Control mice (Cont) were injected with untreated cells. Gemcitabine delayed tumorigenesis and its effect was potentiated by co-treatment with sulforaphane, suppressing tumorigenesis completely during the experimental period. Sulforaphane alone was also effective in completely suppressing the tumorigenesis. The data points for SFN and SFN + GEM (circles on the horizontal axis) were indistinguishable. From Kallifatidis et al. (Citation74), where further details can be found. C. Effect of combining sulforaphane (SFN) with two doses of irradiation, 2 and 6 Grays (Gy), on clonogenic viability (“survival”), relative to control (100%). Four different cell lines were used (AsPC-1, BxPC-3, MiaPaCa-2 and Panc-1), each indicated as a histobar. The effects of the combination were clearly greater than radiotherapy alone (formal statistics not performed). Modified from Naumann et al. (Citation75).
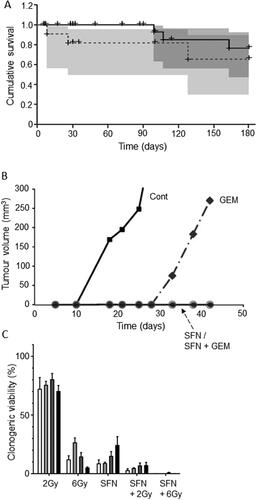
Figure 7. Effects of a nutraceutical compound on PDAC: Artemisinin. A. Effects of dihydroartemisinin (Citation2), gemcitabine (Citation3) and their combination (Citation4) on volume of pancreatic cancer tumors; compared with control (Citation1). BxPC-3 tumors were xenografted in nude mice. Data are presented as means ± standard deviation. The effect of the combination was significantly greater than gemcitabine alone (P < 0.05). B & C. Effects of treatments on status of proliferation (B) and apoptosis (C) determined from tissue sections taken from the induced tumors in (A). Treatments were as follows: gemcitabine (GEM), dihydroartemisinin (DHA) and their combination (GEM + DHA), compared with control (Cont). Data are presented as means ± standard deviation. For both parameters, the effect of the combination was greater than the effect of gemcitabine alone (P < 0.05). From Wang, SJ. et al. (Citation85).
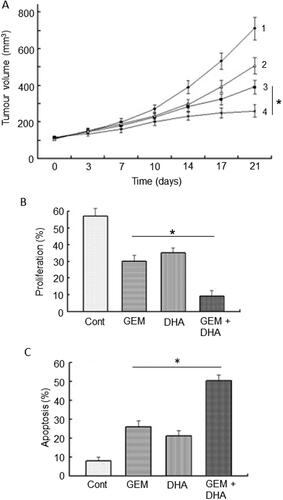
Figure 8. Effects of a nutraceutical compound on PDAC: Garcinol. A. Genetically engineered pancreatic cancer mouse model (KPC). Effects of treatment with garcinol (GAR), gemcitabine (GEM) and their combination on tumorigenesis over five weeks, quantified as the percentage of tumors which increased in size (determined by MRI). The combination produced about a four-fold greater effect than gemcitabine alone (statistics not available). B. Treatments as in (A), showing effects on tumor progression, quantified as the number of observed PanIN1 and PanIN3 lesions (light and dark bars, respectively, emphasized as 1 and 3 in the control data). Data are presented as a percentage of the PanIN1 level in control (Cont). Compared with gemcitabine alone, the combination produced consistently greater effects on both PanIN lesions, but noticeably more on PanIN3. However, significance was not reached, probably due to the limited number of animals used in the study (n = 8 in each group) and the inherent variability of the pathology. Redrawn from data given in Saadat et al. (Citation94).
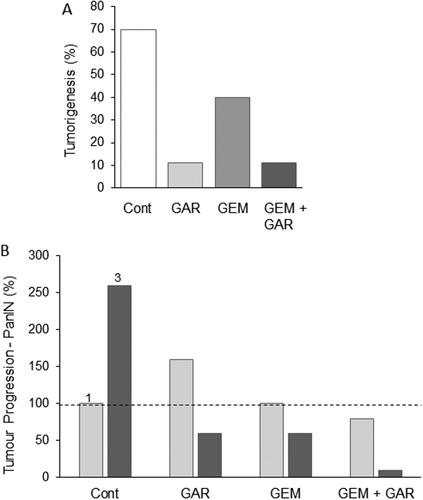
Figure 9. Effects of a nutraceutical compound on PDAC: Thymoquinone. A. Effects of gemcitabine (Citation1), thymoquinone (Citation2) and their combination (Citation3) on the viability of PANC-1 cells. All treatments produced dose-dependent reduction in viability. The effects of the combination were markedly greater than gemcitabine alone at all concentrations tested. Calculations of the “combination index” confirmed significant synergy. From Pandita et al. (Citation99), where further details can be found. B. Effects of thymoquinone (TMQ), gemcitabine (GEM) and their combination (GEM + TMQ), compared with control (Cont), in mice bearing orthotopically induced PANC-1 tumors. Data show effects on both tumor weight (lefthand axis, dark bars) and associated caspase-3 activity (righthand axis, light bars). In both cases, data are shown relative to the respective control level at 100%. For both parameters, the effects of the combination were significantly greater than treatment with gemcitabine alone (P < 0.01 for both). Replotted from data given in Mu et al. (Citation100).
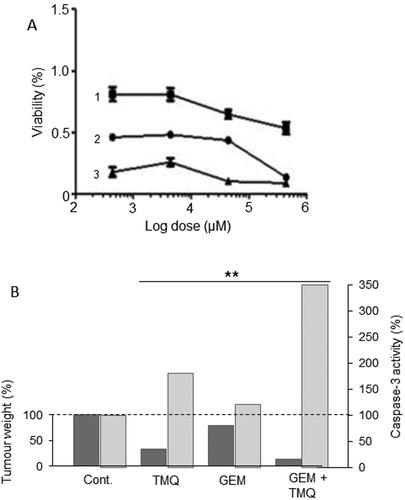
Figure 10. Effects of a nutraceutical compound on PDAC: Emodin. A. Bxpc-3 cells and their gemcitabine-resistant versions (Bxpc-3/Gem) (black and white bars, respectively). Effects of treatment of cells with emodin (EMO), gemcitabine (GEM) and their combination (GEM + EMO) on apoptosis. Data are plotted as a percentage of the control level for Bxpc-3 cells (at 100%). The effect of the combination was significantly greater than gemcitabine alone, but on the resistant cell line only (P < 0.05). The GEM-resistance of the Bxpc-3/Gem cell line was confirmed by significant lack of apoptotic response (P < 0.05). Replotted from data given in Zhang, W. et al. (Citation104). B. Orthotopically induced pancreatic cancer in mice, treated with GEM, EMO and their combination. Tumor weights (in grams) were determined and compared with tumor-bearing control animals treated with saline only (Cont). The effect of the combination was significantly greater than gemcitabine alone (P < 0.05). Modified from Lin, SZ. et al. (Citation106), where further details can be found.
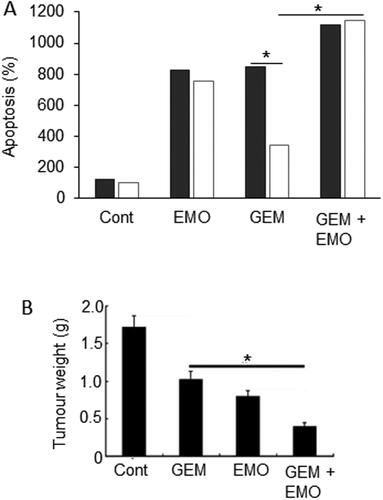
Figure 11. Drug combination: effects of combining aspirin with chemotherapy. A. Forest plot showing improved relative risk of pancreatic cancer resulting from taking aspirin. Diamond indicates the average and the spread of the data. From Qiao et al. (Citation181), where further details and primary data can be found. B. Effects of aspirin (ASP), gemcitabine (GEM) and their combination (GEM + ASP) on volume of tumor induced by orthotopic inoculation of PANC-1 cells in immunodeficient mice. There was a clear trend in the data, the combination producing a significant effect compared to the control (P < 0.05). Although a marked difference between the effects of GEM + ASP and GEM alone was apparent, this did not reach significance, possibly because of the limited number of experimental animals involved (n = 6). C. Data from the same experiment as in (B) showing survival fraction for tumor-bearing mice treated with ASP (Citation2), GEM (Citation3) and their combination (Citation4); control data are indicated as (Citation1). The combination treatment significantly improved survival compared with GEM alone (P < 0.05). B and C, from Zhang, Y. et al. (Citation182).
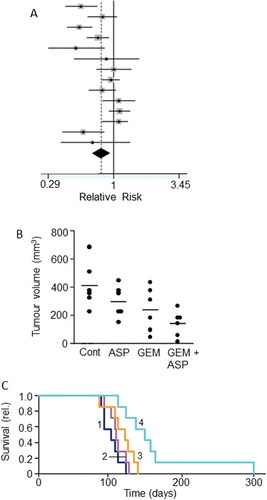
Figure 12. Drug combination: effects of adding metformin to chemotherapy. A. Forest plot demonstrating hazard ratios associated with use of metformin for pancreatic cancer patients. The average (indicated by the diamond) revealed significantly reduced risk (P = 0.01). Modified from Li, X. et al. (Citation198), where further details and primary data can be found. B. Effects of gemcitabine (GEM), metformin (MET) and their combination on tumor weight, compared with untreated controls (Cont), in a gemcitabine-resistant pancreatic cancer (BxG30) mouse xenograft model. Data are plotted relative to the control level at 100%. There was a clear trend, the combination producing a significant effect compared to the control (P < 0.05). Although a noticeable difference between the effects of GEM + MET and GEM alone was apparent, this did not reach significance. Replotted from data given in Suzuki et al. (Citation199). C. Kaplan-Meier survival analysis of KPC mice treated with control/sterile water (Citation1), MET (Citation2), GEM (Citation3) and GEM + MET (Citation4). There was a significant difference between the effects of the combination and GEM alone (P < 0.05), confirming the beneficial effect of the combined treatment. Modified from Qian et al. (Citation200). D. Effects combining metformin (MET) with irradiation (RAD) or RAD + GEM on clonogenic survival of MiaPaCa-2 cells. Survival was quantified as a percentage of total. Adding MET to both RAD or RAD + GEM produced a significant further decrease in survival (P < 0.05 for both comparisons). Modified from Fasih et al. (Citation201).
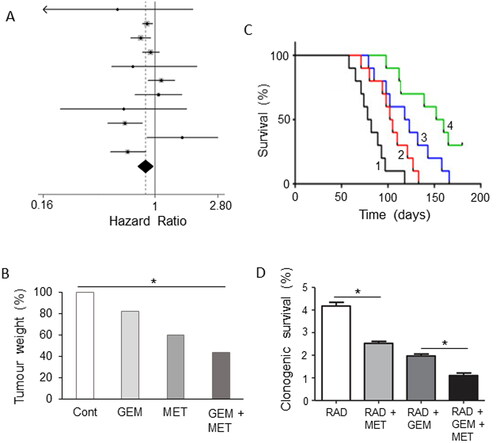
Figure 13. A schematic representation of the homeostatic balance of cancer. The figure illustrates that cancers are under the dynamic influence of opposite factors that promote or suppress the cancer. Depending on their balance, cancer will progress or regress. The horizontal bar indicates steady-state (SS), representing either a cancer-free or a benign state. The ultimate promise of integrated management of cancer is the possibility of living with cancer chronically as long as the balance is kept tilting away from “progression.” Adapted from Djamgoz and Plant (Citation209).