
Figures & data
Figure 1. Structure of Ebola virus and its genome. Ebola virus possesses negative-sense RNA genome with exceptionally 14000 nm length with 3' nucleoprotein and 5' RNA polymerase end.
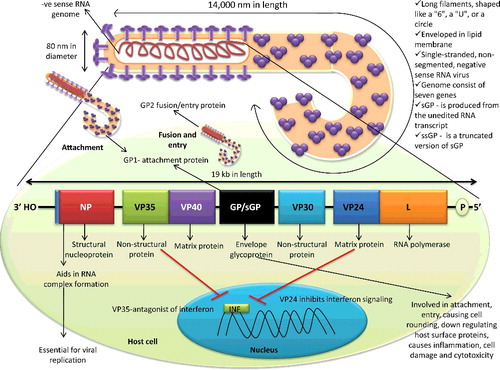
Figure 2. Evolutionary relationships of Ebola virus complete genomes. The evolutionary history was inferred using the Neighbor-Joining method (Saitou & Nei Citation1987). The optimal tree with the sum of branch length = 1.06917633 is shown. The percentage of replicate trees in which the associated taxa clustered together in the bootstrap test (1000 replicates) is shown next to the branches (Felsenstein Citation1985). The tree is drawn to scale, with branch lengths in the same units as those of the evolutionary distances used to infer the phylogenetic tree. The evolutionary distances were computed using the p-distance method (Nei & Kumar Citation2000) and are in the units of the number of base differences per site. The analysis involved 56 nucleotide sequences. Codon positions included were 1st + 2nd + 3rd + Noncoding. All positions containing gaps and missing data were eliminated. There was a total of 17,999 positions in the final data-set. Evolutionary analyses were conducted in MEGA6 (Tamura et al. Citation2013).
Table 1. Outbreaks of Ebolavirus genus between 1976 and March 2016.
Figure 3. Ebola-affected countries on the world map. The coloured area depicts Ebola presence from 1976 to 2016.
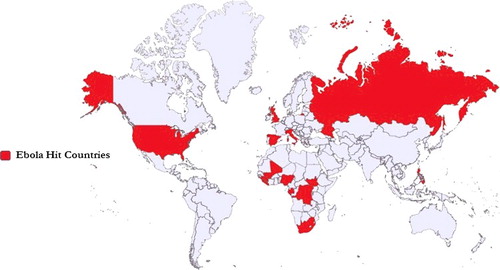
Figure 4. Historical timeline of Ebola virus. The number of outbreaks in Sudan, the Democratic Republic of Congo, Uganda, and Tai Forest are dipcted.
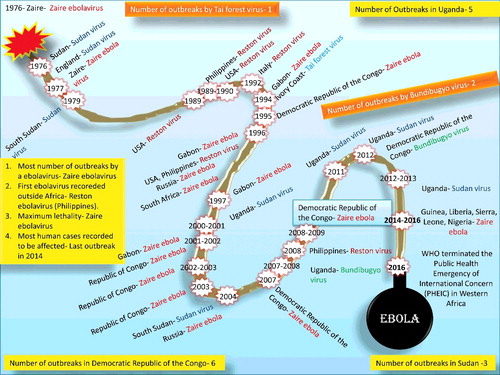
Table 2. Chronological data of Ebola virus cases and fatality since its first incidence.
Figure 5. Transmission, pathogenesis, and clinical signs of Ebola virus.
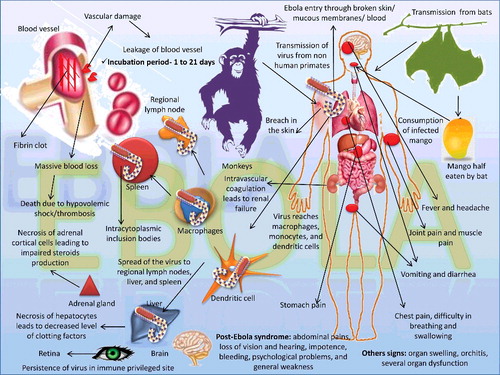
Table 3. Chronology of Ebola diagnosis efforts.
Table 4. Diagnostic kits developed for Ebola virus (EBOV) detection.
Table 5. Different available therapies for Ebola virus treatment.