Figures & data
Figure 1. The PNT morphology under a 100× microscope. (A) L-PNT before DNA binding; (B) S-PNT before DNA binding; (C) L-PNT binding with DNA vaccine; (D) S-PNT binding with DNA vaccine; (E) L-PNT co-culture with BHK-21 cells, for 48 hr; (F) S-PNT co-culture with BHK-21 cells, for 48 hr. The scale bar shows 200 µm.
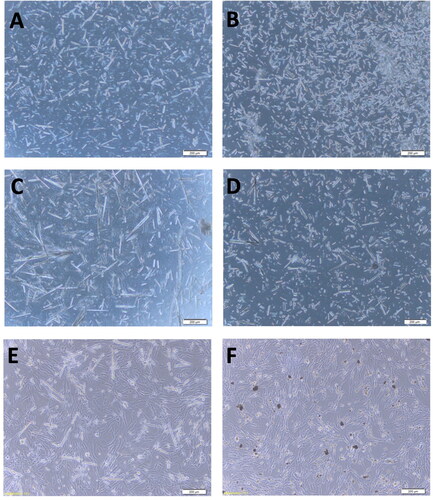
Figure 2. The pTCY/GPV-VP2 DNA vaccine construction map. (A) The GPV VP2 sequence (2200 bp) was cloned into the multi-cloning site after the beta-actin promoter (labeled red-arrow). The unique restriction cutting sites were labeled respectively. (B) The DNA construct was confirmed by KpnI and BamHI restriction enzyme digestion gel electrophoresis. The labeled 1, 2, and 3 were none-treated, double digested colony 1 and 2 plasmid DNA, respectively.
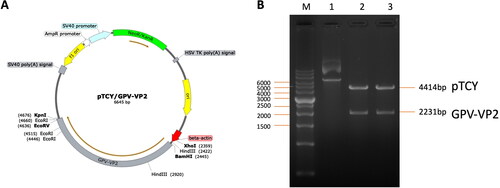
Figure 3. Antibody titers of ducklings orally vaccinated with high or low dosage of DNA vaccine. Ducklings (n = 5) were orally vaccinated with vaccine formulations differing in DNA dosage and cPNT types. (A) Serum IgG and (B) intestinal IgA levels after vaccination were analyzed by ELISA. The titers were calculated as S/P ratios and presented as mean ± SD. Different superscript letters(a,b) indicate significant differences between treatment groups. Analyzed by ANOVA Duncan’s Multiple Range Test (α = 0.05).
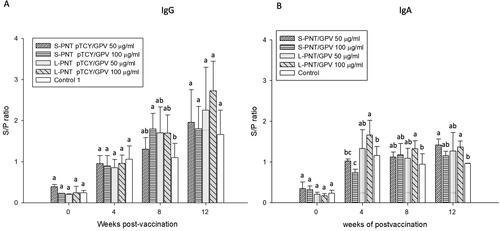
Figure 4. Immunohistochemistry of duck organs after vaccination. Ducklings were orally vaccinated and two organs, intestine (upper) and liver (lower) were isolated for IHC staining by using anti-VP2 antibody. The GPV-infected animal sample (A and G) and non-infected tissues (D and J) served as positive and negative controls, respectively. Tissues from the pTCY/GPV + PNT oral vaccinated (B, E, H, and K) and the saline mock vaccinated (C, F, I, and L) group ducklings are shown. Arrows indicate VP2-positive cells.
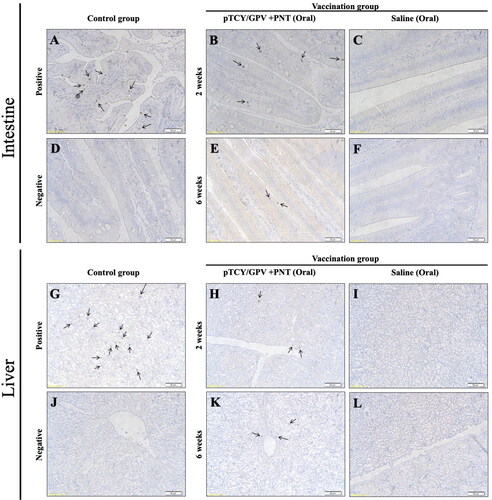
Figure 5. The IgG and IgA induction of the cPNT (L/S PNT) DNA vaccine administration. Two groups of 9-day-old ducklings (n = 20) were orally vaccinated by the cPNT GPV-VP2 (100 μg DNA/dose) on day 0 and boosted on day 14. The serum IgG (A) and IgA (B) at 0-, 2- and 3-weeks post-vaccination was analyzed by ELISA. The antibody titer results were calculated into S/P ratio and presented as mean ± SD and analyzed by ANOVA Duncan’s Multiple Range Test (α = 0.05). S/P ratio = (sample OD value − negative OD value)/(positive OD value − negative OD value).
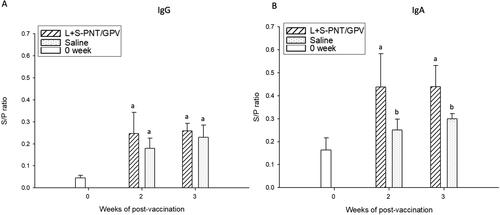
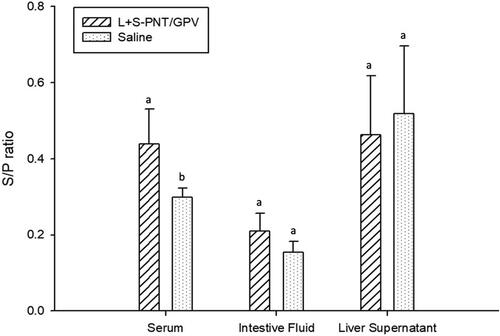
Figure 6. The IgA induction of the cPNT (L/S PNT) DNA vaccine administration in a different organ. Two groups of 9-day-old ducklings (n = 20) were orally vaccinated with the cPNT GPV-VP2 (100 μg DNA/dose) vaccine or saline on day 0 and boosted on day 14. The IgA titer at 0-, 2- and 3-weeks post-vaccination was analyzed by ELISA. The antibody titer results were calculated into S/P ratio and presented as mean ± SD and analyzed by ANOVA Duncan’s Multiple Range Test (α = 0.05). S/P ratio = (sample OD value − negative OD value)/(positive OD value − negative OD value).