Figures & data
Figure 1. Schematic illustration of the combination of imaging modalities in the present study. Laser speckle (LSCI) and hyperspectral imaging (HSI), being so-called “light in – light out” techniques, provide 2D maps of the surface capable of depicting the tumor blood perfusion and oxygen saturation respectively. Photoacoustic imaging (PAI), a “light in – sound out” technique, can provide 3D maps of the molecular properties of tumor. The combination of techniques thereby has the capacity to provide detailed information of the functional and molecular properties of tumors useful in preoperative assessment.
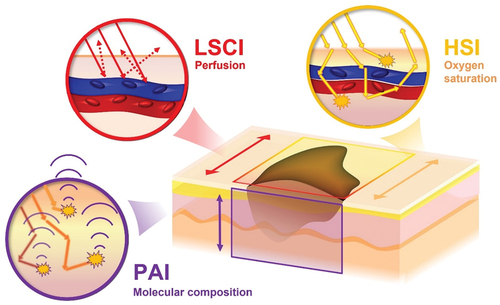
Figure 2. Laser speckle contrast imaging of the angiosarcoma, showing an intensity map on the left (a), and the corresponding perfusion map on the right (b). Perfusion in the tumor is markedly higher than in the surrounding skin. Perfusion and intensity are expressed in arbitrary units, intensity counts and perfusion units (PU). Both images are scaled the same and the scale bar represents 10mm.
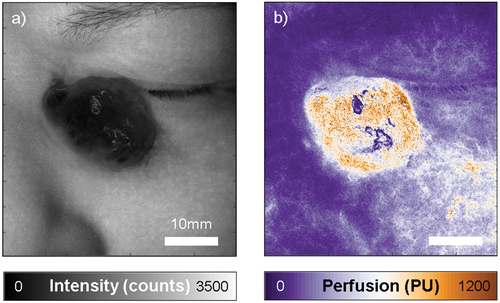
Figure 3. Hyperspectral imaging of the angiosarcoma in vivo with the corresponding photograph (a). The spectra in the tumor and the healthy skin shown in (b) were analyzed in the two regions of interest indicated by the red and black squares in (a). The solid lines indicate the measured spectra and the circles indicate the fit obtained by spectral unmixing (SU) of the measured spectra using the endmembers melanin, HbO2 and HbR, collagen, fat, and water. From the spectral unmixing, we calculate HbT (c) and sO2 (d). Note the increase in HbT and decrease in sO2 in the tumor, suggesting the pooling of deoxygenated blood. Scale bar represents 10mm.
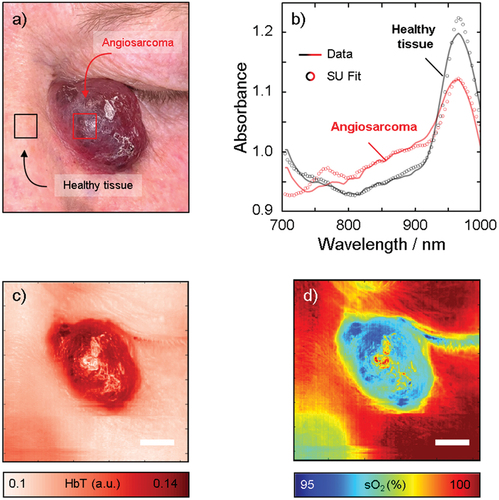
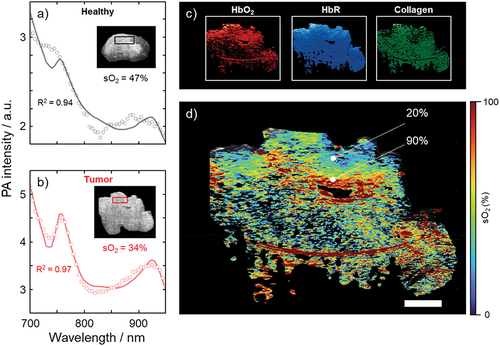
Figure 4. Results of photoacoustic imaging of the angiosarcoma, ex vivo. The spectra in healthy tissue (a) and the tumor (b) were analyzed in the two regions of interest (black and red squares, respectively) indicated in the inset cross-sectional ultrasound images. Spectral unmixing was performed to obtain maps of the relative contributions of the endmembers HbO2, HbR, and collagen (c), from which an oxygen saturation map was generated (d), according to the method outlined above. Scale bar represents 10 mm. R2 represents the coefficient of determination indicating how well the spectral unmixing model fits the data.