Figures & data
Figure 1 Memory of shock was, overall, more “negative” for white1118 mutants. (A) Adult flies were trained with two odors and pulses of electric shock. Between the groups, we varied the interval between the as-yet-to-be-learned odor and the shock (interstimulus interval; ISI). Negative ISIs indicate odor-then-shock presentation; positive values reflect shock-then-odor presentation. For each ISI, two subgroups were trained reciprocally, that is, with switched roles for the odors 3-octanol (OCT) and benzaldehyde (BA). After training, each reciprocal group was allowed to choose between the two odors; based on their odor preferences (PREFs), we calculated a learning index (LI). Positive LIs indicate conditioned approach, and negative values mean conditioned avoidance. (B) For wild-type control flies, the “sign” of conditioned behavior depended on the ISI: If, during training, the odor had shortly preceded or overlapped with shock (ISI = −45, −15, or 0 s), control flies later on avoided it. If, during training, the odor had closely followed shock (ISI = 20 or 40 s), control flies later approached it. If the two events were too far apart in time (−150, 70, or 200 s), flies showed no signs of conditioned behavior. Concerning the white1118 mutants, scores overall were shifted “southward,” that is, toward stronger conditioned avoidance. Sample sizes for the very long ISIs are lower because Tanimoto et al. (Citation2004) and Yarali et al. (Citation2008) showed that for such very long ISIs, the learning indices are zero in the wild type. In other words, expecting any kind of nonzero score for ISIs longer than 1 minute between odor and shock seems unlikely, in any genotype, such that differences between genotypes are unlikely, too. Therefore, a lack of difference for the long ISIs, although based on a small sample size, likely is real. * P < 0.05/8, while comparing between genotypes (i.e., Bonferroni correction; see Methods for details). Box plots represent the median as the midline; 25 and 75% as the box boundaries and 10 and 90% as the whiskers. (C) Control and white1118 mutant flies avoided shock indistinguishably well. NS, P > 0.05. Box plots are as in (B).
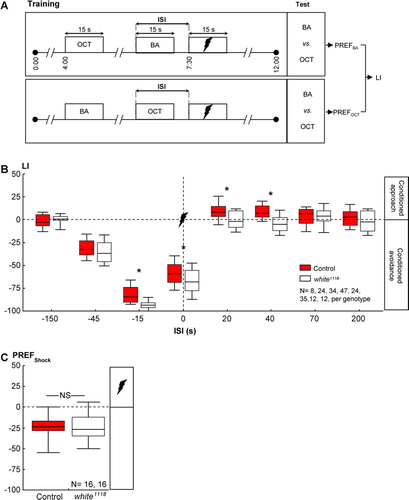
Figure 2 Loss of white-function did not affect olfactory reward learning in adult Drosophila. (A) Adult flies were successively exposed to an as-yet-to-be-learned odor in the presence of sugar and to a control odor without any sugar. Two subgroups were trained reciprocally, that is, with switched roles for the odors 3-octanol (OCT) and benzaldehyde (BA). Both subgroups were then given the choice between the two odors; a learning index (LI) was calculated based on their odor preferences (PREFs). Positive values indicate a conditioned approach toward the learned odor. (B) Control flies and white1118 mutants performed equally well in such reward learning. Details are as in C.
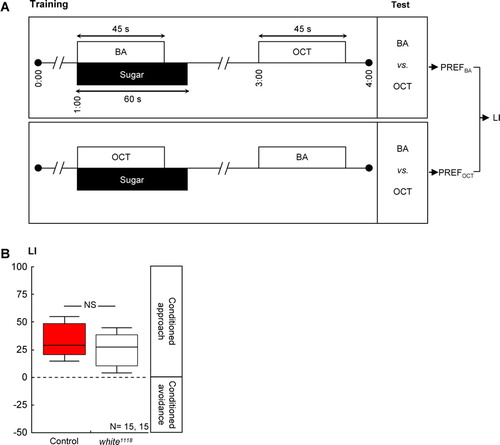
Figure 3 Loss of white-function did not affect olfactory reward learning in larval Drosophila. (A) Larvae were successively exposed to the odor n-amylacetate (AM), in the presence of sugar and to a no-odor situation (Empty) without any sugar. Another group of larvae was trained reciprocally. Both groups were then tested for their response to AM; a learning index (LI) was calculated based on their AM preferences (PREF). Positive LI values indicate appetitive learning. (B) Control larvae and white1118 mutant larvae performed equally well in such reward learning. Details are as in C.
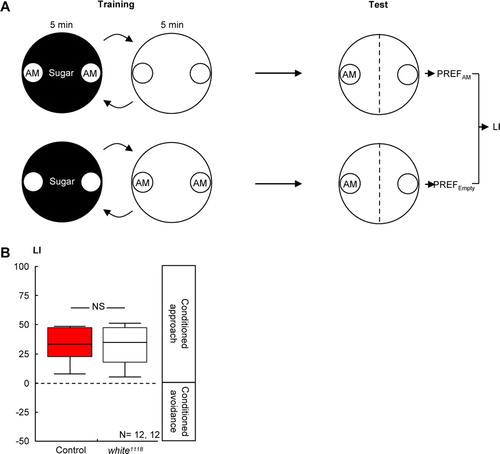
Table 1 Multireaction monitoring mode transitions and conditions for the measurement of biogenic amines.
Figure 4 Loss of white-function did not affect the adult brain amounts of biogenic amines. High-pressure liquid chromatography, coupled to tandem mass spectrometry, revealed no difference between wild-type controls and white1118 mutants in terms of the brain amounts of octopamine, tyramine, dopamine, or serotonin. From samples that each included 10 brains, we report amine levels as pg per single brain. NS, P > 0.05. Box plots are as in B.
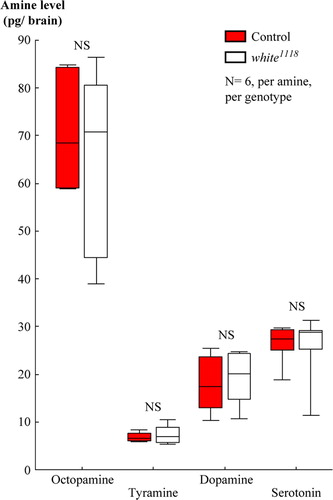
Figure 5 Meta-analysis of amine amounts. We compared various high-pressure liquid chromatography (HPLC)-based studies (color coded) in terms of the biogenic amine amounts they found in whole-head (triangles) or only-brain (circles) homogenates from wild-type control or white1118 mutant flies. We plotted mean values throughout in pg/brain or head to enable comparison between studies. Please note the different Y-axes for each amine.
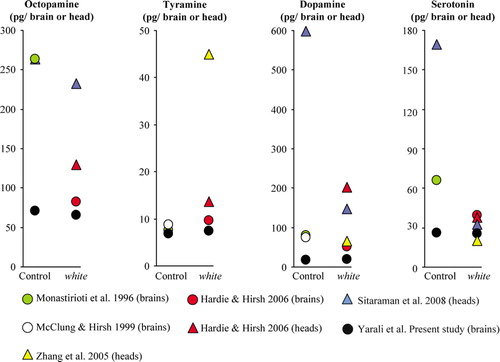
Figure 6 Assessment of serotonin measurement. (A) Using high-pressure liquid chromatography coupled with tandem amss spectrometry (HPLC-MS/MS), we analyzed a series of samples, each containing 5 ng of [D4]serotonin and a known amount of unlabeled serotonin, ranging from 5 to 1000 pg. For each sample, we plot the measured amount of unlabeled serotonin against the actual, known amount. Mean ± standard deviations were obtained from three independent measurements. The black arrow marks the mean total amount of serotonin we found in a homogenate of 10 wild-type brains (i.e., we multiplied the single-brain value from by 10). (A′) Close-up on the lower range of (A). (B) Example HPLC-MS/MS chromatograms for unlabeled serotonin (top) and labeled [D4]serotonin (bottom) over a solvent “background.” As expected, their retention times were equal. (B′) Example HPLC-MS/MS chromatograms obtained by analyzing a homogenate of 10 wild-type brains, added with isotope-labeled serotonin (5 ng). Both unlabeled, endogenous serotonin (top) and labeled [D4]serotonin (bottom) are clearly detectable. As expected, their retention times were the same. Note that the signal-to-noise ratio for the measurements over the solvent background in (B) does not apparently differ from the measurements over the brain-homogenate background. On the top-right corner of (B) and (B′), the first line indicates the specific MRM transitions and the second line the maximal ion current in arbitrary units.
![Figure 6 Assessment of serotonin measurement. (A) Using high-pressure liquid chromatography coupled with tandem amss spectrometry (HPLC-MS/MS), we analyzed a series of samples, each containing 5 ng of [D4]serotonin and a known amount of unlabeled serotonin, ranging from 5 to 1000 pg. For each sample, we plot the measured amount of unlabeled serotonin against the actual, known amount. Mean ± standard deviations were obtained from three independent measurements. The black arrow marks the mean total amount of serotonin we found in a homogenate of 10 wild-type brains (i.e., we multiplied the single-brain value from Figure 4 by 10). (A′) Close-up on the lower range of (A). (B) Example HPLC-MS/MS chromatograms for unlabeled serotonin (top) and labeled [D4]serotonin (bottom) over a solvent “background.” As expected, their retention times were equal. (B′) Example HPLC-MS/MS chromatograms obtained by analyzing a homogenate of 10 wild-type brains, added with isotope-labeled serotonin (5 ng). Both unlabeled, endogenous serotonin (top) and labeled [D4]serotonin (bottom) are clearly detectable. As expected, their retention times were the same. Note that the signal-to-noise ratio for the measurements over the solvent background in (B) does not apparently differ from the measurements over the brain-homogenate background. On the top-right corner of (B) and (B′), the first line indicates the specific MRM transitions and the second line the maximal ion current in arbitrary units.](/cms/asset/715e5f3f-a585-416e-a72d-da4b89148937/ineg_a_344305_f0006_b.gif)