Figures & data
FIGURE 1 Simvastatin prevents the development and progression of pulmonary arterial hypertension in pneumonectomized, MCT-treated rats. (A) Mean pulmonary arterial pressures (mPAPs) in group PM1−21 (pneumonectomized, MCT-treated rats that were sacrificed on day 21; n = 10), Group PM1−35 (pneumonectomized, MCT-treated rats that were sacrificed on day 35; n = 8), and control (normal rats; n = 10). Bars are means ± SD. *P <.001 for groups PM1−21 and PM1−35 versus control; # P <.001 for group PM1−21 versus group PM1−35. (B) Mean pulmonary arterial pressures (mPAPs) in group PM1−35 as stated in A, group PMV1−35 (MCT-treated, pneumonectomized rats that received vehicle from days 1 to 35; n = 9), group PMS1−35 (MCT-treated, pneumonectomized rats that received simvastatin [2 mg/kg per day] from days 1 to 35; n = 12), group PMV21−35 (MCT-treated, pneumonectomized rats that received vehicle from days 21 to 35; n = 8), group PMS21−35 (MCT-treated, pneumonectomized rats that received simvastatin [2 mg/kg per day] from days 21 to 35; n = 10). Bars are means ± SD. § P <.001 for group PMS1−35 versus group PMV1−35; ** P <.001 for group PMS21−35 versus group PMV21−35; *** P <.001 for Group PMS1−35 versus group PMS21−35.
![FIGURE 1 Simvastatin prevents the development and progression of pulmonary arterial hypertension in pneumonectomized, MCT-treated rats. (A) Mean pulmonary arterial pressures (mPAPs) in group PM1−21 (pneumonectomized, MCT-treated rats that were sacrificed on day 21; n = 10), Group PM1−35 (pneumonectomized, MCT-treated rats that were sacrificed on day 35; n = 8), and control (normal rats; n = 10). Bars are means ± SD. *P <.001 for groups PM1−21 and PM1−35 versus control; # P <.001 for group PM1−21 versus group PM1−35. (B) Mean pulmonary arterial pressures (mPAPs) in group PM1−35 as stated in A, group PMV1−35 (MCT-treated, pneumonectomized rats that received vehicle from days 1 to 35; n = 9), group PMS1−35 (MCT-treated, pneumonectomized rats that received simvastatin [2 mg/kg per day] from days 1 to 35; n = 12), group PMV21−35 (MCT-treated, pneumonectomized rats that received vehicle from days 21 to 35; n = 8), group PMS21−35 (MCT-treated, pneumonectomized rats that received simvastatin [2 mg/kg per day] from days 21 to 35; n = 10). Bars are means ± SD. § P <.001 for group PMS1−35 versus group PMV1−35; ** P <.001 for group PMS21−35 versus group PMV21−35; *** P <.001 for Group PMS1−35 versus group PMS21−35.](/cms/asset/6bc520ff-1aea-46cb-ae8a-4a344c10d808/ielu_a_373851_uf0001_b.gif)
FIGURE 2 Simvastatin prevents the development and progression of right ventricular hypertrophy in pneumonectomized, MCT-treated rats. (A) Ratios of right vertricular weight to left ventricular and interventricular septal weights [RV/(LV + S)] are shown among the 3 groups of rats as stated in . Bars are means ± SD. * P <.001 for groups PM1−21 and PM1−35 versus control; # P <.001 for group PM1−35 versus group PM1−21. (B) Ratios of RV/(LV + S) are shown for the 5 groups of rats as stated in . Bars are means ± SD. § P <.001 for group PMS1−35 versus group PMV1−35; ** P <.001 for group PMS21−35 versus group PMV21−35; *** P <.001 for group PMS21−35 versus group PM1−35.
![FIGURE 2 Simvastatin prevents the development and progression of right ventricular hypertrophy in pneumonectomized, MCT-treated rats. (A) Ratios of right vertricular weight to left ventricular and interventricular septal weights [RV/(LV + S)] are shown among the 3 groups of rats as stated in Figure 1A. Bars are means ± SD. * P <.001 for groups PM1−21 and PM1−35 versus control; # P <.001 for group PM1−35 versus group PM1−21. (B) Ratios of RV/(LV + S) are shown for the 5 groups of rats as stated in Figure 1B. Bars are means ± SD. § P <.001 for group PMS1−35 versus group PMV1−35; ** P <.001 for group PMS21−35 versus group PMV21−35; *** P <.001 for group PMS21−35 versus group PM1−35.](/cms/asset/6e7d886e-af86-459c-aa79-7d7a2639d482/ielu_a_373851_uf0002_b.gif)
FIGURE 3 Simvastatin prevents the development of small pulmonary artery hypertrophy in pneumonectomized, MCT-treated rats. (A) Control; (B) PMV1−35; (C) PMV21−35; (D) PM1−35; (E) PMS1−35; (F) PMS21−35. Elastin–van Gieson staining (magnification, × 200) images show reduced small pulmonary artery hypertrophy in Groups PMS1−35 and PMS21−35.
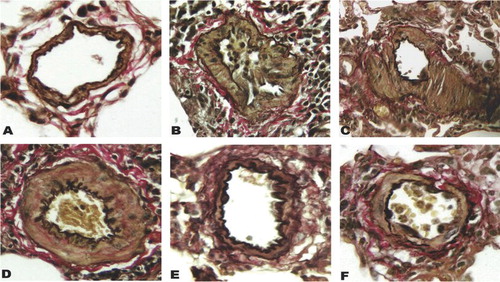
FIGURE 4 Reduced percent medial wall thickness of small pulmonary artery hypertrophy in pneumonectomized, MCT-treated rats by simvastatin. Small pulmonary artery (50 to 150 μm) hypertrophy measured by (2 × medial thickness/external diameter) × 100. (A) Percent medial wall thickness is shown among the 3 groups of rats as stated in . Bars are means ± SD. * P <.001 for Groups PM1−21 and PM1−35 versus control; # P <.001 for group PM1−35 versus group PM1−21. (B) Percent medial wall thickness is shown among the 5 groups of rats as stated in . Bars are means ± SD. Simvastatin alleviated arterial medial hypertrophy in pneumonectomized, monocrotaline-treated rats (§ P <.001 for group PMS1−35 versus group PMV1−35; ▵ P <.001 for group PMS21−35 versus group PMV21−35). Group PMS1−35 had significantly lower percent medial wall thickness than group PMS21−35 (*** P <.05).
FIGURE 5 Simvastatin suppresses the development of pulmonary arterial neointimal formation. The vascular occlusion score (VOS) was the average of 50 consecutive intra-acinar pulmonary arteries. (A) Normal rat intra-acinar artery without evidence of neointimal proliferation (grade 0). (B, C, and D) Grade 2 neointimal lesions (> 50% luminal occlusion) in groups PM1−35, PMV1−35, and PMV21−35. (E) Predominance of grade 2 lesson in group PMS21−35. (F) Grade 1 neointimal lesion (< 50% lumenal occlusion) in group PMS1−35. All samples were stained with EVG. The images are × 400 magnification. (G) Average grades of VOS among the 6 groups of rats as stated in and B. * P <.001 for group PM1−35 versus control; * P <.001 for group PMS1−35 versus group PMV1−35; * P <.001 for group PMS21−35 versus group PMV21−35; * P <.001 for group PMS1−35 versus group PMS21−35, respectively.
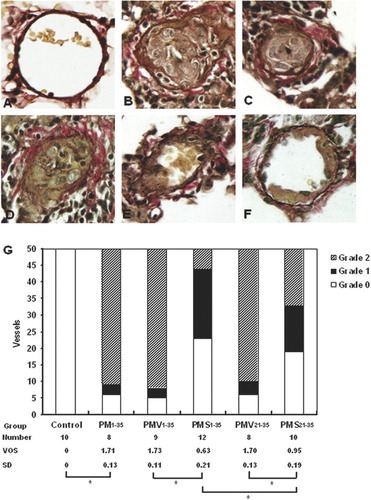
FIGURE 6 Reduction in GATA-6 mRNA expression during the development of pulmonary hypertension in pneumonectomized, MCT-treated rats that was reversed by simvastatin. (A) RT-PCR analysis of GATA-6 and β-actin gene expression in representative rat lungs from groups stated in and . (B) Relative abundance of GATA-6/β-actin mRNA expression among the 3 groups of rats stated in . Mean and standard deviation of GATA-6 mRNA expression normalized to β-actin is shown (n = 3/group). * P <.001 for groups PM1−21 and PM1−35 versus control; # P <.01 for group PM1−35 versus group PM1−21. (C) Relative abundance of GATA-6/β-actin mRNA expression among the 5 groups of rats stated in . Mean and standard deviation of GATA-6 mRNA expression normalized to β-actin is shown (n = 3/group). Simvastatin restored GATA6 mRNA expression level in diseased rats (** P <.001 for group PMS1−35 versus group PMV1−35; §P <.001 for group PMS21−35 versus group PMV21−35). Group PMS1−35 had significantly higher GATA-6 mRNA expression level than Group PMS21−35 (*** P <.01).
FIGURE 7 Decrease in GATA-6 protein expression during the development of pulmonary hypertension in pneumonectomized, MCT-treated rats that was restored by simvastatin. (A) Western blotting analysis of GATA-6 protein expression in representative rat lung protein extracts from each group as stated in and . (B) Relative abundance of GATA-6/β-actin protein expression among the three groups of rats stated in . Mean and standard deviation of GATA-6 protein expression normalized to β-actin is shown (n = 3/group). * P <.001 for group PM1−35 versus control; ** P <.01 for group PM1−21 versus control; # P <.01 for group PM1−35 versus group PM1−21. (C) Relative abundance of GATA-6/ β-actin protein expression among the 5 groups of rats stated in . Mean and standard deviation of GATA-6 protein expression normalized to β-actin is shown (n = 3/group). Simvastatin restored GATA-6 protein expression level in diseased rats (*** P <.001 for group PMV1−35 versus group PMS1−35; § P <.001 for group PMV21−35 versus group PMS21−35). Group PMS1−35 had significantly higher GATA-6 protein expression level than group PMS21−35 (**** P <.01).