Figures & data
Figure 1. Acquisition of migratory capacity of AECs after mechanical injury. Confluent primary AECs monolayers plated into labteck were mechanically injured by scratch. At T0 and 16 hours later, cells were fixed and immunostaining of α-SMA or TTF1 were performed. Images were presented in 8-bit grey panel. A calibration bar has been added in each picture. A representative picture of at least n = 3 independent AEC cultures for each condition has been presented. Original magnification: × 200, Scale Bar rep-resent 50 µm.
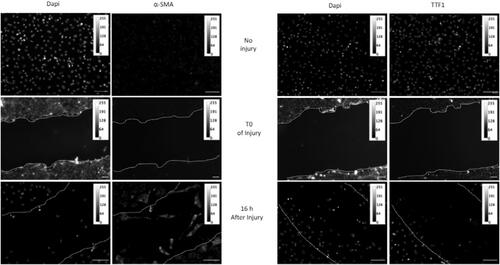
Figure 2. Implication of TGF-β1 in the wound healing capacity of AECs. (A) Confluent primary AECs were mechanically injured. 24h later, TGF-β1 release was evaluated by ELISA in the supernatant. (B-D) Confluent primary AECs monolayer were mechanical-ly injured, and treated either with 1 ng/ml of recombinant TGF-β1 (B) or with 10 µM SB431542 (SB), an inhibitor of TGF-β1 type 1 receptor kinase (C-D). 16 hours (B) or 24 hours (C-D) later, cells were fixed and wound closure was determined as a percentage of the area recovered at the end of the experiment as compared to the same area at the beginning. Analysis has been done with Image J software. Raw data were submitted a t test with Welsh correction. At least n = 5 independent experiments from lungs of n = 3 distinct rats have been done for each condition. A representative picture has been presented. * indicates a significant difference as compared with control value with p < 0.05, ** p < 0.005, *** p < 0.001. Original magnification: × 200. Scale bar represent 15 µm. (E) Cells were injured and treated or not with 10 µM SB431542 (SB). 16 hours after injury, cells were fixed and immunostaining of α-SMA were performed. Images were presented in 8-bit grey panel. A calibration bar has been added in each picture. A representative picture has been presented. Original magnification: × 200, Scale Bar rep-resent 50 µm.
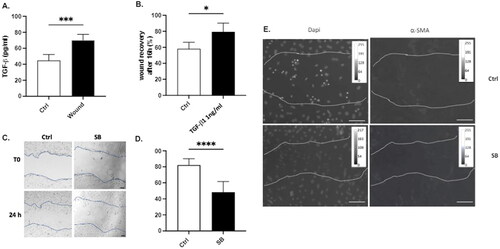
Figure 3. Activation of HIF and UPR signaling pathways. Primary AECs transfected with plasmid coding for luciferase reporter activity of hypoxia responsive element (HRE: i.e., HIF), amino acid response element (AARE: i.e., ATF4-luc) endoplasmic reticulum stress element (ERSE: i.e., ATF6N/sXBP1-luc), or CHOP promotor were mechanically injured or not and cultured for 24h. Luciferase activity corresponding to the transcriptional capacity of HIF (A), ATF4 (B), ATF6N (C) or activation of CHOP promotor (D) was measured. Independent experiments from lungs of n = 3 distinct rats have been done for each condition. Raw data were submitted to a Welsh’s t-test. * indicates a significant difference as compared with control value with p < 0.05.
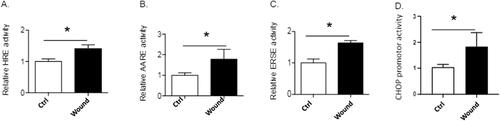
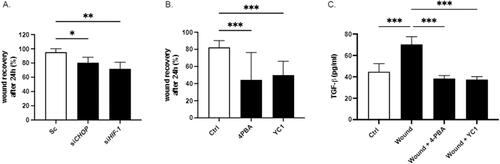
Figure 4. Inhibition of ER stress and HIF-1α activation limits wound closure and TGF-β1 secretion. (A) A549 cells were transfected with scrambled (sc) siRNA, CHOP siRNA and HIF-1α siRNA. Confluent monolayers were then mechanically injured. 24 hours later, cells were fixed and wound closure was determined. (B) Confluent primary AECs monolayer were mechanically injured and treated with either 100 mM of the ER stress inhibitor 4-PBA or 10 µM of the HIF inhibitor YC-1. 24 hours later, cells were fixed and wound closure was determined. (A-B) Wound closure was determined as a percentage of the area recovered at the end of the experiment as compared to the same area at the beginning. Analyses have been done with Image J software. (C) Confluent primary AECs monolayer were mechanically injured and treated with either 100 mM of 4-PBA or 10 µM of YC-1. 24h later, TGF-β1 release was evaluated by ELISA in the supernatant. Raw data were submitted to an ordinary one way ANOVA with Sidak’s multiple comparison test. At least n = 5 independent experiments from lungs of n = 3 distinct rats have been done for each condition. A representative picture has been presented. * indicates a significant difference as compared with control value, # indicates a significant difference as compared with wound value. * or # indicates a p < 0.05; ** or ## indicates a p < 0.005, *** or ### indicate a p < 0.001.