Figures & data
Figure 1. Outline of the experimental design. Abbreviations: Ers, elastance of the respiratory system; i.m., intramuscularly; i.p., intraperitoneally; i.v.; intravenously; PEEP, positive end-expiratory pressure; Rrs, resistance of the respiratory system.
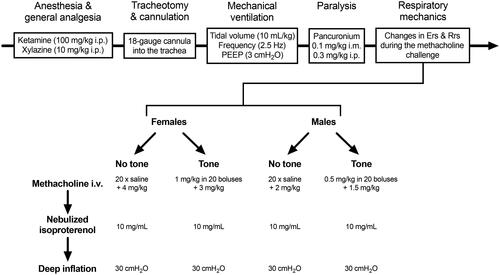
Figure 2. Tone (i.e., a sustained activation of the airway smooth muscle) induced by methacholine. Changes in respiratory system elastance relative to baseline (ΔErs) caused by 20 serial i.v. doses of saline (black) or methacholine (gray). Vertical black dotted lines, 65 s apart, indicate when doses were delivered. Only the first 3 doses and the 20th one prior to the final higher dose are indicated for clarity. The red vertical dotted line indicates when the higher final i.v. dose was delivered. These results are also shown in (first ∼20 min of the upper left graph), but on a different scale. Data are means + or - SD for a n = 6. The dosing regimen was identical in females, except that all doses were twice lower.
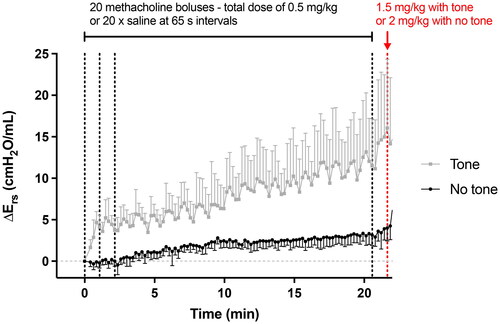
Figure 3. The effect of tone on the methacholine-induced changes in respiratory system elastance relative to baseline (ΔErs). The upper left and right graphs demonstrate the actual changes in Ers throughout the whole protocol in both males and females, respectively. Note that the scale on the y-axis is smaller in females than males. The three vertical red dotted lines from left to right indicate when: 1- the final i.v. dose of methacholine was administered; 2- the nebulized dose of isoproterenol (Iso) was administered; and 3- the deep inspiration (DI) was imposed. In the bottom graph, the max Ers after the final dose (i.e., peak response), as well as the minimal Ers after Iso and the DI, are compared between challenges with and without tone in each sex. Results of two-way ANOVAs are shown below the graph, which were used to evaluate the effect of tone, the combined effect of Iso and the DI, and their interaction within each sex. Asterisks are from post hoc analyses, showing significant differences between challenges with and without tone for the max response (**** is p < 0.0001). Data are means + or - SD for a n = 6.
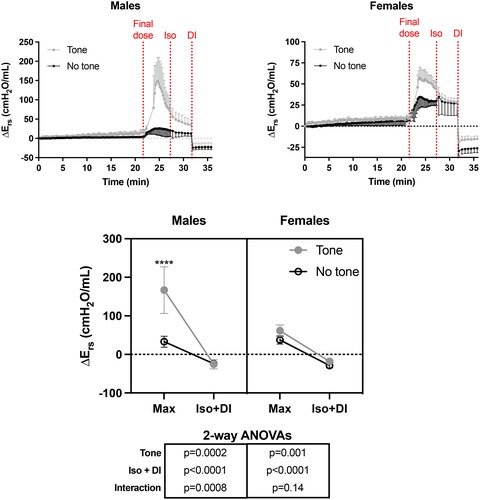
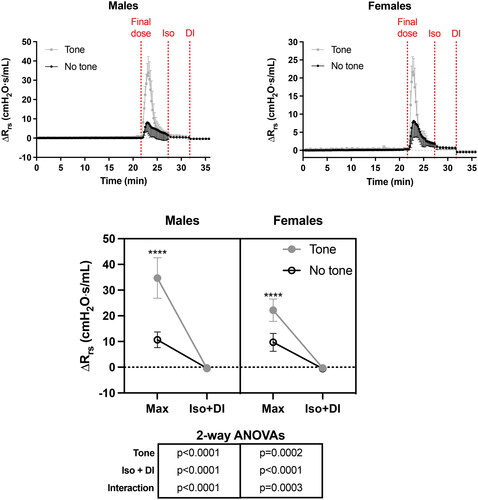
Figure 4. The effect of tone on the methacholine-induced changes in respiratory system resistance relative to baseline (ΔRrs). The upper left and right graphs demonstrate the actual changes in Rrs throughout the whole protocol in both males and females, respectively. Note that the scale on the y-axis is smaller in females than males. The three vertical red dotted lines from left to right indicate when: 1- the last i.v. dose of methacholine was administered; 2- the nebulized dose of isoproterenol (Iso) was administered; and 3- the deep inspiration (DI) was imposed. In the bottom graph, the max Rrs after the final dose (i.e., peak response), as well as the minimal Rrs after Iso and the DI, are compared between challenges with and without tone in each sex. Results of two-way ANOVAs are shown below the graph, which were used to evaluate the effect of tone, the combined effect of Iso and the DI, and their interaction within each sex. Asterisks are from post hoc analyses, showing significant differences between challenges with and without tone for the max response (**** is p < 0.0001). Data are means + or - SD for a n = 6.