Figures & data
Figure 1. Effect of LPS on placenta and alveolar development in neonatal rats. (a, b) H&E staining of placental tissue and comparison of neutrophil counts between two groups. The data were expressed as mean ± SEM for n = 6 rats/group (****p < 0.0001). (c–e) Comparison of pathological manifestations, RAC and MLI values in lung tissues at each postnatal time point (P0, P1.5, P3, P5, and P7) between the control and LPS groups. Data are expressed as the mean ± SEM for n = 6 rats/group (*p < 0.05 at P3, **p < 0.01 at P5, and ***p < 0.05 at P7). P0, P1.5, P3, P5, and P7 are postnatal time points.
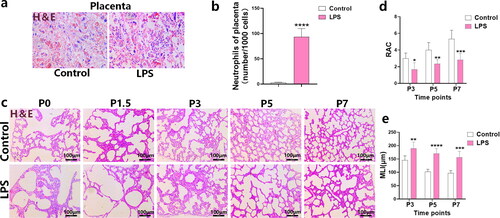
Figure 2. Effects of LPS on pyroptosis in neonatal rat lung tissues. (a, b) The ratio of dead cells to all cells (per 1000 cells) at each postnatal time point (P0, P1.5, P3, P5, and P7) in the BPD and control groups was compared using TUNEL staining (n = 6 rats/group; ***p < 0.001 and ****p < 0.0001). (c–f) Relative levels of the indicators related to pyroptosis: Pro-caspase-1, caspase-1, NLRP3, Pro-IL-1β, IL-1β, IL-18/Pro-IL-18, GSDMD-N/GSDMD, Pro-caspase-11, and caspase-11 in lung tissues of the BPD and LPS groups, measured via western blotting. Data are expressed as mean ± SEM for n = 6 rats/group (*p < 0.05, **p < 0.01, ***p < 0.001 and ****p < 0.0001).
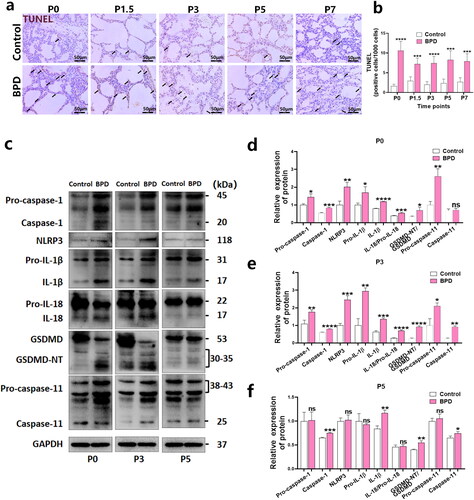
Figure 3. Rapamycin promotes alveolar development in BPD. (a-g) RAC and MLI values of the four groups (control, BPD, BPD + rapamycin, and BPD + MHY1485) were compared at P2, P5, and P14 using hematoxylin and eosin staining. Data are expressed as mean ± SEM for n = 6 rats/group (*p < 0.05, **p < 0.01, ***p < 0.001 and ****p < 0.0001). (h) Macroscopic specimens of lung tissue from the four groups are also shown. The morphology, including the size, of the left lung of neonatal rats was observed mainly from the dorsal side. *P represents the statistical data values of the control and BPD groups, BPD and BPD + rapamycin groups, and BPD and BPD + MHY1485 groups.
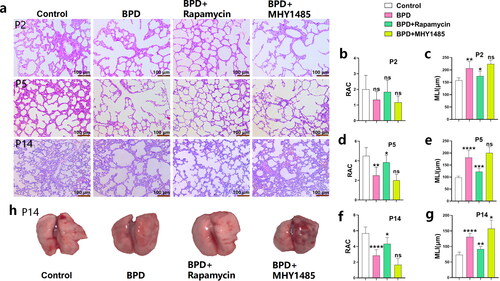
Figure 4. Rapamycin upregulates autophagy levels in BPD. (a–d) The phosphorylation levels of Akt and mTOR in lung tissues of the BPD and control groups were detected using western blotting at P0 and P3. Quantitative comparisons of p-Akt/Akt and p-mTOR/mTOR levels were performed. Data are expressed as the mean ± SEM for n = 6 rats/group (*p < 0.05, **p < 0.01, and ***p < 0.001). (e–h) The effects of rapamycin and MHY1485 treatments on p-mTOR/mTOR, p62, and LC3 II/I levels in BPD at P2 were examined. Data are expressed as the mean ± SEM for n = 6 rats/group (*p < 0.05 and **p < 0.01). (i, j) The p62 immunofluorescence images and mean fluorescence intensity analysis showed the differences observed at P2 following rapamycin and MHY1485 treatment. Data are expressed as the mean ± SEM for n = 6 rats/group (****p < 0.0001).
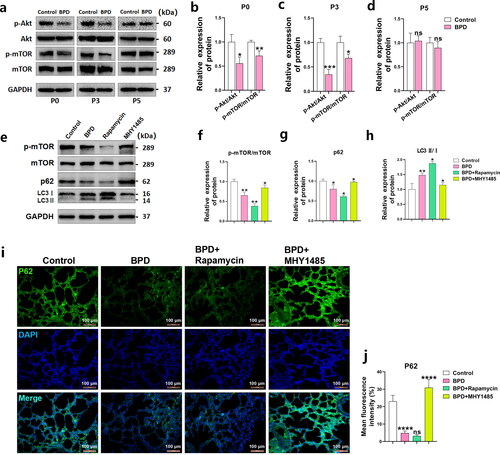
Figure 5. Rapamycin reduces NLRP3 inflammasome activation and attenuates pyroptosis levels in BPD. (a, b) TUNEL-positive cells rates (per 1000 cells) were counted to evaluate the degree of pyroptosis in lung tissues of four groups (control, BPD, BPD + rapamycin, and BPD + MHY1485) at P2. Data are expressed as the mean ± SEM for n = 6 rats/group (*p < 0.05, **p < 0.01, and ****p < 0.0001). (c–j) The relative levels of Pro-caspase-1, caspase-1, NLRP3, Pro-IL-1β, IL-1β, IL-18/Pro-IL-18, GSDMD-N/GSDMD, Pro-caspase-11, and caspase-11 in these four groups was detected using western blotting; the grey value was determined. Data are expressed as the mean ± SEM for n = 6 rats/group (*p < 0.05, **p < 0.01, ***p < 0.001, and ****p < 0.0001). (k l) Tissue immunofluorescence was used to analyze differences in NLRP3 levels among groups. Data are expressed as the mean ± SEM for n = 6 rats/group (*p < 0.05, ***p < 0.001, and ****p < 0.0001).
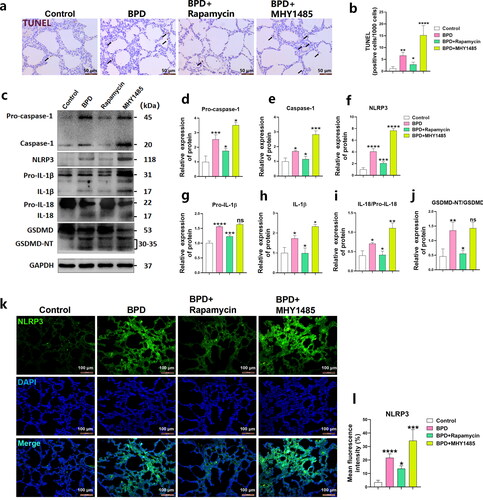
Figure 6. Rapamycin reduces caspase-11 inflammasome production in BPD. (a–c) The relative levels of Pro-caspase-11 and caspase-11 in the four groups (control, BPD, BPD + rapamycin, and BPD + MHY1485) was detected using western blotting; the differences in grey value among the groups were compared. Data are expressed as the mean ± SEM for n = 6 rats/group (*p < 0.05, **p < 0.01, and ****p < 0.0001). (d, e) Tissue immunofluorescence was used to analyze differences in caspase-11 levels among groups. Data are expressed as the mean ± SEM for n = 6 rats/group (***p < 0.001, and ****p < 0.0001).
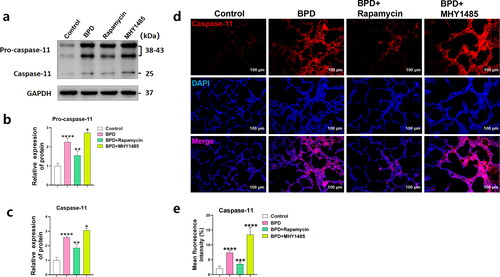
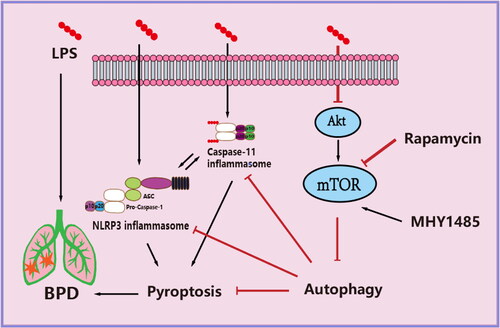
Figure 7. Schematic of the mechanism by which rapamycin attenuates pyroptosis induced by LPS in bronchopulmonary dysplasia rats. mTOR phosphorylation is inhibited and autophagy promoted.