
Figures & data
Figure 1. The level of CLCA1 is increased in ARDS patients.
80 participates, including 26 patients with ARDS, 26 patients with CAP and 28 control subjects with isolated pulmonary nodules or mass lesions, were enrolled in this research. A. The level of CLCA1 in human Bronchoalveolar lavage fluid (BALF) detected by ELISA, *P < 0.05, compared with control; #P < 0.05, compared with CAP. B. The ratio of neutrophils in human Bronchoalveolar lavage fluid (BALF) calculated by BALF cells counting, *P < 0.05, compared with control; #P < 0.05, compared with CAP. C. Liner regression analysis for the ratio of neutrophils and the level of CLCA1. D. The level of CLCA1 in survivors and non-survivors of ARDS detected by ELISA, *P < 0.05, compared with survivors; #P < 0.05, compared with the baseline of survivors.
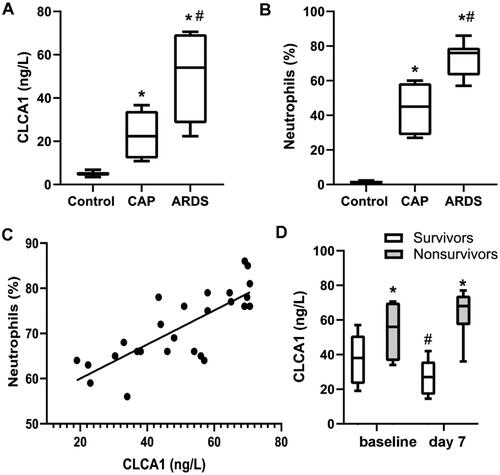
Table 1. Clinical characteristics of the ARDS patients.
Figure 2. LPS stimulation elevates the level of CLCA1 in ARDS mouse model.
A. The survival rate of LPS-stimulated mice, mice were intratracheally administrated with different concentrations of LPS (0, 2.5, 5.0 and 10.0 mg/kg), n = 12. B. The lung injury score of LPS-stimulated mice, n = 6, *P < 0.05, **P < 0.01, compared with PBS group, #P < 0.05, compared with LPS-2.5 group. C. The BALF protein concentration of LPS-stimulated mice, n = 6, *P < 0.05, **P < 0.01, compared with PBS group, ##P < 0.01, compared with LPS-2.5 group. D. The total BALF cells of LPS-stimulated mice, n = 6. ***P < 0.001, compared with PBS group, #P < 0.05, compared with LPS-2.5 group. E. H&E staining of murine lung sections, scale bar 100μm. F. The lung W/D weight ratio of LPS-stimulated mice, n = 6, *P < 0.05, compared with PBS group. G. the level of TNF-α and IL-6 in LPS stimulated mice detected by ELISA, *P < 0.05, **P < 0.01, compared with PBS group; ## P < 0.01, compared with LPS-2.5 group. H. The number of BALF neutrophils in LPS stimulated mice, n = 6, **P < 0.01. I. The level of CXCL1 and CXCL2 in LPS stimulated mice detected by ELISA, n = 6, **P < 0.01. J. The level of CLCA1 in LPS stimulated mice detected by ELISA, n = 6, **P < 0.01, compared with PBS group. K. The murine lung sections were dyed by immunohistochemistry stain, the brown area is specific staining of CLCA1, scale bar 100 μm.
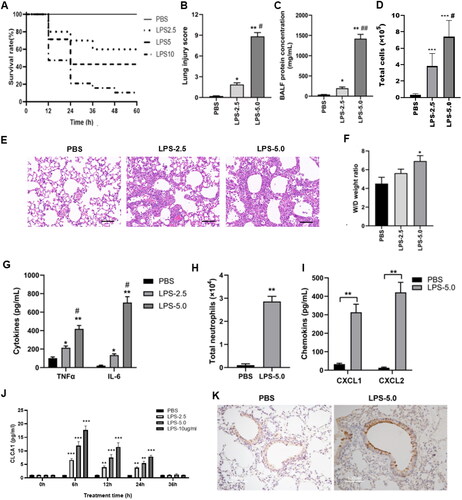
Figure 3. CLCA1 Exacerbates pulmonary inflammation, lung injury and inflammatory cytokines release in ARDS mouse model.
A. H&E staining of murine lung sections, scale bar 100μm. B. The lung injury score of ARDS mouse model, n = 6, *P < 0.05, compared with PBS group; #P < 0.05 compared with LPS group. C. The lung wet/dry weight ratio of ARDS mouse model, n = 6, *P < 0.05, compared with PBS group; #P < 0.05 compared with LPS group. D. The BALF protein concentration of ARDS mouse model, n = 6, **P < 0.01, compared with PBS group; #P < 0.05, ##P < 0.01, compared with LPS group. E. The number of BALF neutrophils in ARDS mouse model, n = 6, **P < 0.01, compared with PBS group; #P < 0.05, ##p < 0.01, compared with LPS group. F. The level of inflammatory cytokines in ARDS mouse model detected by ELISA, including IL-6, TNF-α, CXCL1 and CXCL2, n = 6, ** p < 0.01, compared with PBS group; #p < 0.05, ##p < 0.01, compared with LPS group.
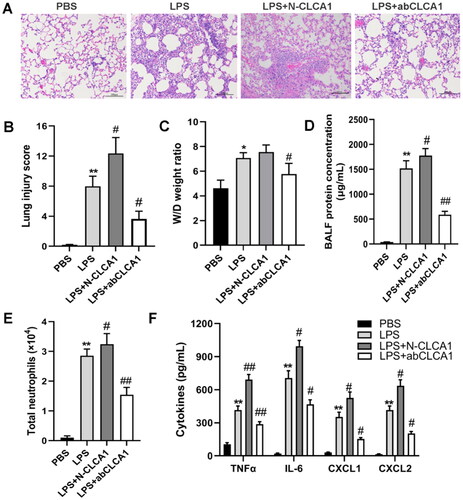
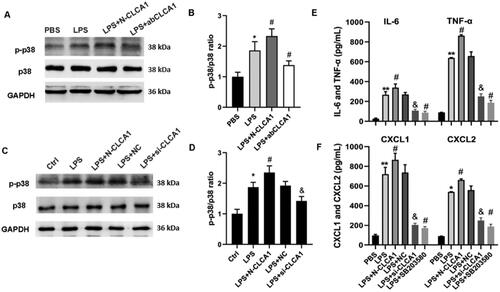
Figure 4. CLCA1 Modulates the release of inflammatory factors via p38 MAPK activation.
A. P38 expression was detected by western blot in ARDS mouse model. B. The ratio of p38 expression western blot in ARDS mouse model, n = 6, **P < 0.01, compared with PBS group; #p < 0.05, compared with LPS group. C. P38 expression was detected by western blot in 16HBE cells. D. The ratio of p38 expression western blot in ARDS mouse model, n = 6, *P < 0.05, compared with PBS group; #P < 0.05, compared with LPS group; &P < 0.05, compared with LPS + NC group. E. The concentrations of TNF-ɑ and IL-6 in 16HBE cells were detected by ELISA, n = 6, **P < 0.01, compared with PBS group; #P < 0.05, compared with LPS group; &P < 0.05, compared with LPS + NC group. F. The concentrations of CXCL1 and CXCL2 16HBE cells were detected by ELISA, n = 6, *p < 0.05, **P < 0.01, compared with PBS group; #P < 0.05, compared with LPS group; &P < 0.05, compared with LPS + NC group.
Data availability statement
The raw data supporting the conclusions of this article will be made available by the authors, without undue reservation.