
Figures & data
Table 1. Primer sequences for qRT-PCR.
Figure 1. GBP5 Expression was altered in mouse ARDS models.
(A) Bar graphs showing population data of GBP5 mRNA levels in LPS and control groups from lung tissue of ARDS mice model (n = 5). (B) Same as (A), but in BALF. (C) Example images of IHC staining for GBP5 in lung tissue. (D) Population data of GBP5 mRNA levels in an ARDS cell model established by LPS-induced MLE-12 cell lines. (E) Same as (D), but in protein levels. Structures represent mean ± SD. The asterisk indicates p < 0.05.
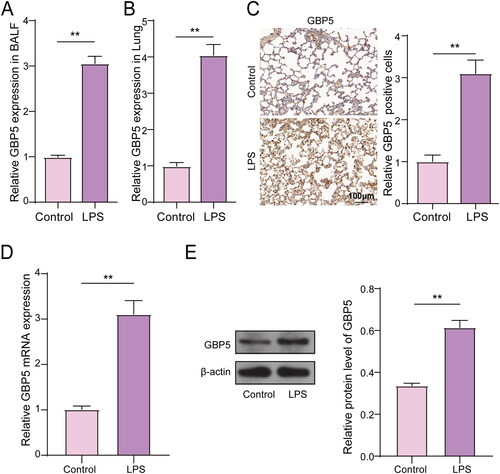
Figure 2. Reducing GBP5 levels inhibited lung inflammation induced by LPS in mice.
(A) Bar graph showing population data of GBP5 levels in BALF for the Control, LPS + sh-NC, and LPS + sh-GBP5 groups. n = 5 mice. (B) HE staining images showing pathological changes in lung tissue. (C) Bar graph showing the results of MPO activity assay. (D) Representative images of IHC staining for CD68 in lung tissue. (E) Spread dot plot showing ELISA measurements of inflammatory factors TNF-α and IL-1β in BALF. Structures represent mean ± SD. ** p < 0.01, *** p < 0.001.
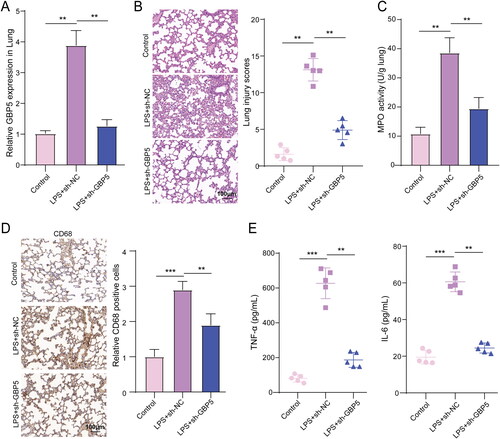
Figure 3. Decreasing GBP5 expression increased autophagy that LPS suppressed in ARDS mice.
(A) Representative immunofluorescence images showing LC3B for the Control, LPS + sh-NC, and LPS + sh-GBP5 groups.
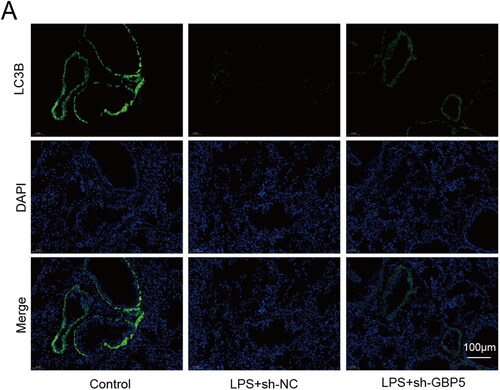
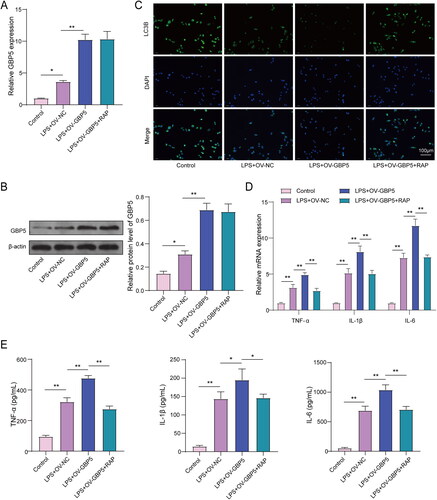
Figure 4. GBP5 Increased inflammation in LPS-stimulated MLE-12 cells by suppressing autophagy.
ARDS cell model established by LPS-induced MLE-12 cell lines (n = 3). (A) Bar graphs showing RT-qPCR measurements of GBP5 mRNA levels in LPS-stimulated MLE-12 cells used to create an ARDS cell model. Groups: Control, LPS + OV-NC, LPS + OV-GBP5, LPS + OV-GBP5 + RAP. (B) Same as (A), but showing protein levels from WB. (C) Graph showing population data of immunofluorescence detection of autophagy-related protein LC3B. (D-E) Population data of RT-qPCR and ELISA measurements of TNF-α, IL-1β, and IL-6. Structures represent mean ± SD.* p < 0.05, ** p < 0.01.
Data availability statement
All data generated or analyzed during this study are included in this published article.