
Figures & data
Figure 1. Participant flow chart.
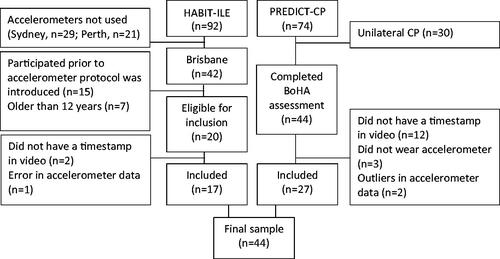
Table 1. Sample characteristics.
Table 2. Mean both hands (BoHA) assessment units and mean activity counts by manual ability classification scale (MACS) level, BoHA Each-Hand Sub-scores and mean activity counts for the dominant and non-dominant hand by MACS level and BoHA percentage difference between hand and mean activity asymmetry index by MACS level.
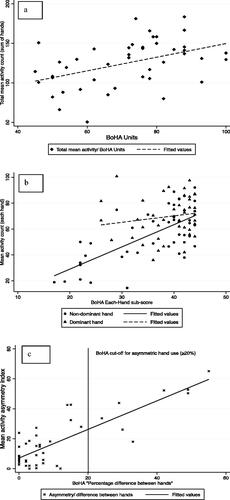
Figure 2. (a) Association between BoHA units and total mean activity. (b) Association between BoHA Each-Hand Sub-score and mean activity by limb. (c) Association between the mean activity and BoHA asymmetry indexes of X children with bilateral cerebral palsy.
Data availability statement
Data of this study are available on request from the authors.