
Figures & data
Figure 1. The study area and synoptic station clusters.
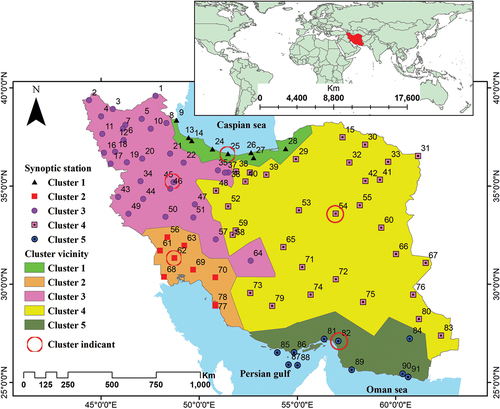
Table 1. Information on the AR6 (The Sixth Assessment Report) climate models used in this study.
Table 2. Summary of SSP (The Shared Socio-economic Pathway) narratives.
Table 3. List of extreme precipitation indices used in this study.
Figure 2. Root mean square relative error (RMSRE) (top) and decreasing sorted sum of RMSRE (bottom) for the nine extreme precipitation indices (EPIs) for 41 GCMs.
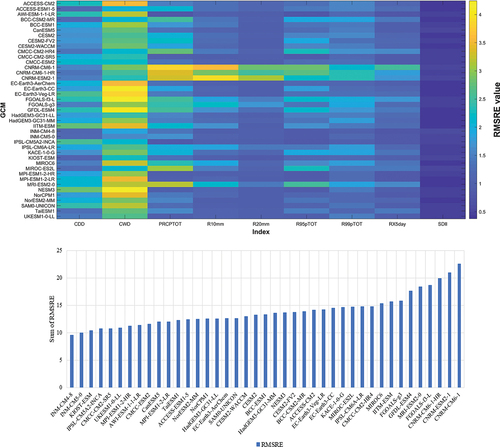
Figure 3. Percent bias (PBias) (top) and decreasing sorted sum of the absolute PBias (bottom) for the nine EPIs for 41 GCMs.
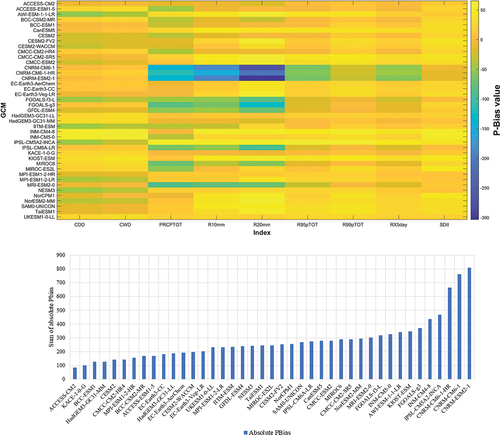
Figure 4. Annual precipitation projected by GCMs (top: ACCESS-CM2, bottom: INM-CM4-8) during the future period (2023–2099) under climate change scenarios SSP1-2.6 (left) and SSP5-8.5 (right).
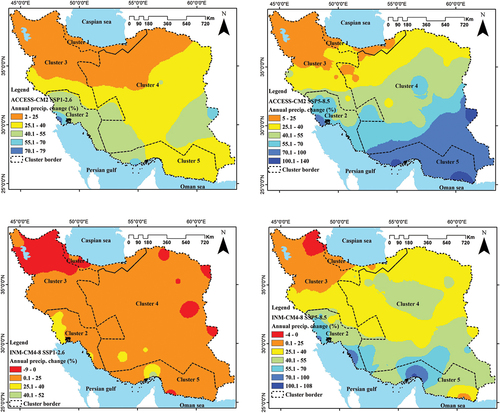
Figure 5. MME (The Multi-Model Ensemble) projected precipitation variation during the future period (2023–2099) under climate change scenarios SSP1-2.6 (left) and SSP5-8.5 (right).
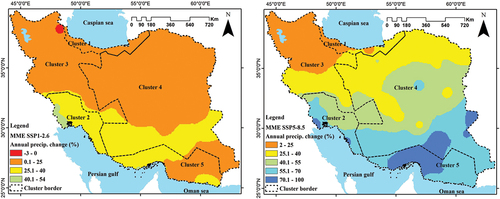
Figure 6. Precipitation variation based on SSP1-2.6 and a multi-model ensemble (ACCESS-CM2 and INM-CM4-8) during the future period (2023–2099). Each plot is for a representative station of a particular cluster.
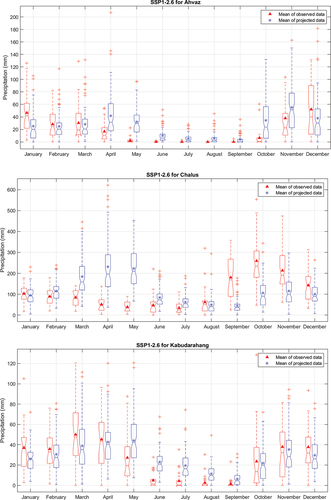
Figure 6. (Continued).
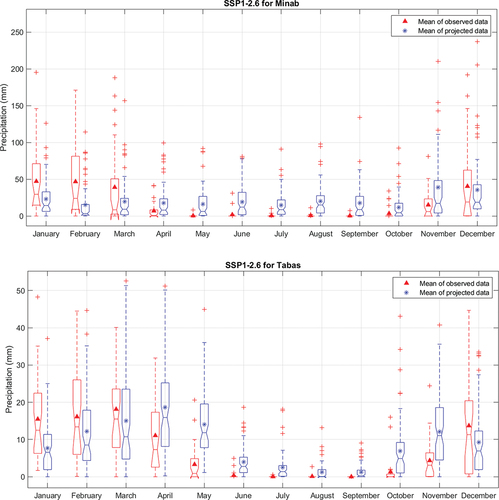
Figure 7. Precipitation variation based on SSP5-8.5 and a multi-model ensemble (ACCESS-CM2 and INM-CM4-8) during the future period (2023–2099). Each plot is for a representative station of a particular cluster.
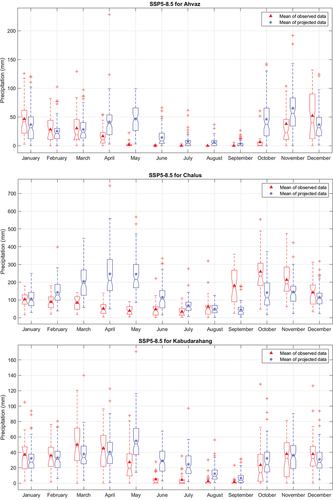
Figure 7. (Continued).
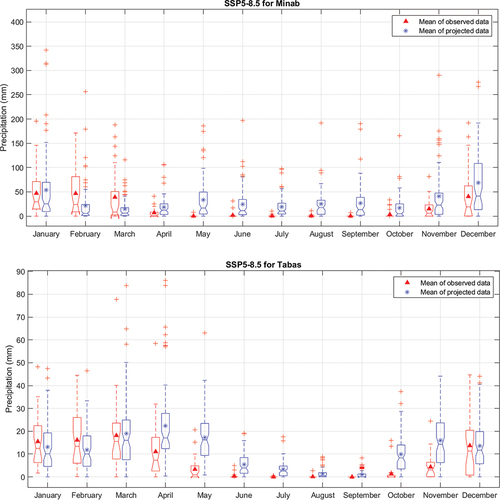
Figure 8. The effect of extreme values on the observed average annual precipitation during the future period (2023–2099).
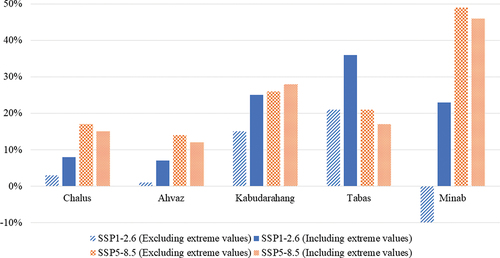
Figure 9. The effect of extreme values on the average annual precipitation during the future period (2023–2099) for SSP5-8.5.
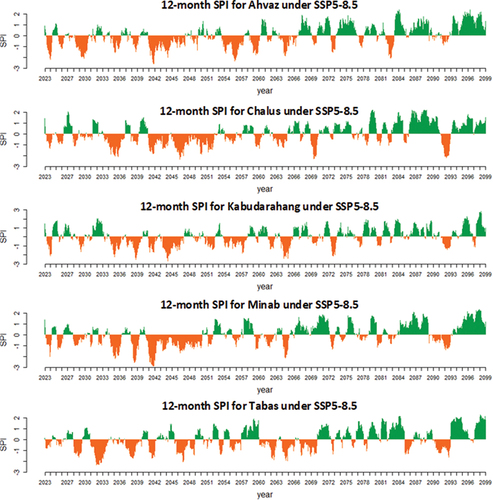
Figure 10. The effect of extreme values on the average annual precipitation during the future period (2023–2099) for SSP1-2.6.
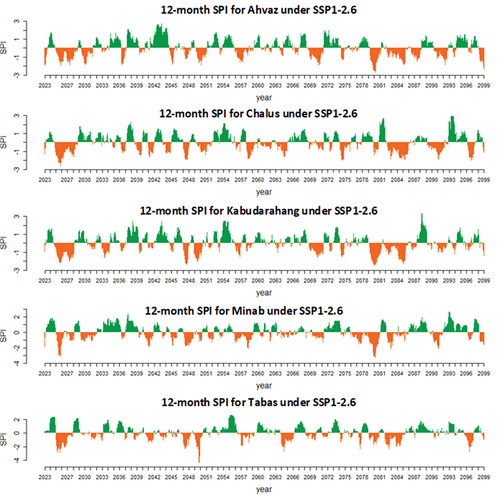
Table 4. The best-fitted distributions for copulas.
Figure 11. The joint drought return period due to SSP1-2.6 and multi-model ensemble (ACCESS-CM2 and INM-CM4-8).
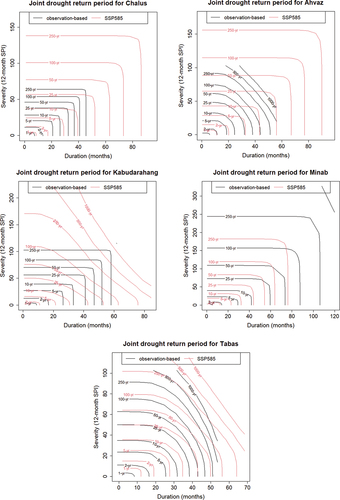
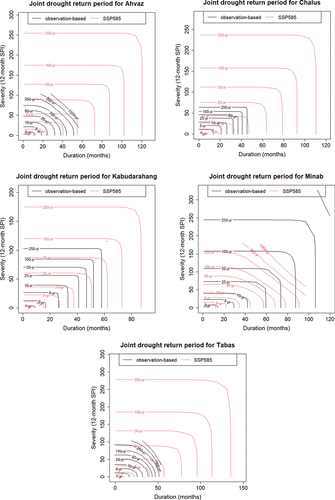
Figure 12. The joint drought return period due to SSP5-8.5 and multi-model ensemble (ACCESS-CM2 and INM-CM4-8).
Data availability statement
All data described in the main text are available. The observed dataset of synoptic stations is available from Iran’s meteorological organization website (https://data.irimo.ir/). All climate model simulations are from CMIP6 and are publicly available, and are hosted on various servers including the Copernicus datasets (https://cds.climate.copernicus.eu/cdsapp#!/dataset/projections-cmip6?tab=form).
References
- Abbasian, M., Moghim, S., and Abrishamchi, A., 2019. Performance of the general circulation models in simulating temperature and precipitation over Iran. Theoretical and Applied Climatology, 135 (3–4), 1465–1483. doi:10.1007/s00704-018-2456-y.
- Ahmed, S.M., 2020. Impacts of drought, food security policy and climate change on performance of irrigation schemes in Sub-saharan Africa: the case of Sudan. Agricultural Water Management, 232, 106064. doi:10.1016/j.agwat.2020.106064.
- Akinsanola, A.A., Ongoma, V., and Kooperman, G.J., 2021. Evaluation of CMIP6 models in simulating the statistics of extreme precipitation over Eastern Africa. Atmospheric Research, 254, 105509. doi:10.1016/j.atmosres.2021.105509.
- Awadh, S.M., 2023. Impact of North African sand and dust storms on the Middle East using Iraq as an example: causes, sources, and mitigation. Atmosphere, 14 (1), 180. doi:10.3390/atmos14010180.
- Ballarin, A.S., et al., 2021. A copula-based drought assessment framework considering global simulation models. Journal of Hydrology: Regional Studies, 38, 100970.
- Behzadi, F., et al., 2022. Meteorological drought duration–severity and climate change impact in Iran. Theoretical and Applied Climatology, 149 (3), 1297–1315. doi:10.1007/s00704-022-04113-5.
- Bethke, I., et al., 2019. NCC NorCPM1 model output prepared for CMIP6 CMIP. Norway: Earth System Grid Federation. doi:10.22033/ESGF/CMIP6.10843.
- Bezak, N., Zabret, K., and Šraj, M., 2018. Application of copula functions for rainfall interception modelling. Water, 10 (8), 995. doi:10.3390/w10080995.
- Bi, D., et al., 2020. Configuration and spin-up of ACCESS-CM2, the new generation Australian community climate and earth system simulator coupled model. Journal of Southern Hemisphere Earth Systems Science, 70 (1), 225–251. doi:10.1071/ES19040.
- Boucher, O., et al., 2018. Ipsl ipsl-cm6a-lr model output prepared for cmip6 cmip historical. Earth System Grid Federation. doi:10.22033/ESGF/CMIP6.5195.
- Byun, Y.-H., et al., 2019. NIMS-KMA KACE1.0-G model output prepared for CMIP6 CMIP amip. England: Earth System Grid Federation. doi:10.22033/ESGF/CMIP6.8350.
- Caliński, T. and Harabasz, J., 1974. A dendrite method for cluster analysis. Communications in Statistics-Theory and Methods, 3 (1), 1–27. doi:10.1080/03610927408827101.
- Cammalleri, C., et al., 2022. The effects of non-stationarity on SPI for operational drought monitoring in Europe. International Journal of Climatology, 42 (6), 3418–3430. doi:10.1002/joc.7424.
- Clarke, L.E., 2007. Scenarios of greenhouse gas emissions and atmospheric concentrations: report. Vol. 2. Washington, DC., USA: Department of Energy, Office of Biological & Environmental Research.
- Cong, R.-G. and Brady, M., 2012. The interdependence between rainfall and temperature: copula analyses. The Scientific World Journal, 2012, 1–11. doi:10.1100/2012/405675.
- Danabasoglu, G., et al., 2019. NCAR CESM2 model output prepared for CMIP6 CMIP historical. Earth System Grid Federation, Version, 20190912, 485.
- Deng, M., et al., 2011. An adaptive spatial clustering algorithm based on Delaunay triangulation. Computers, Environment and Urban Systems, 35 (4), 320–332. doi:10.1016/j.compenvurbsys.2011.02.003.
- Dezfuli, A., Razavi, S., and Zaitchik, B.F., 2022. Compound effects of climate change on future transboundary water issues in the Middle East. Earth’s Future, 10 (4), e2022EF002683. doi:10.1029/2022EF002683.
- (EC-Earth), E.-E. C, 2019. EC-Earth-Consortium EC-Earth3 model output prepared for CMIP6 CMIP historical. Spain: Earth System Grid Federation. doi:10.22033/ESGF/CMIP6.4700.
- Favre, A., et al., 2004. Multivariate hydrological frequency analysis using copulas. Water Resources Research, 40 (1). doi:10.1029/2003WR002456.
- Fawzy, S., et al., 2020. Strategies for mitigation of climate change: a review. Environmental Chemistry Letters, 18 (6), 2069–2094. doi:10.1007/s10311-020-01059-w.
- Gudmundsson, L., et al., 2012. Downscaling RCM precipitation to the station scale using statistical transformations–a comparison of methods. Hydrology and Earth System Sciences, 16 (9), 3383–3390. doi:10.5194/hess-16-3383-2012.
- Gudmundsson, L., 2012. Technical note: downscaling RCM precipitation to the station scale using quantile mapping – a comparison of methods. Hydrology and Earth System Sciences Discussions, 9 (5), 6185–6201. doi:10.5194/hessd-9-6185-2012.
- Haile, G.G., et al., 2020. Projected impacts of climate change on drought patterns over East Africa. Earth’s Future, 8 (7), e2020EF001502. doi:10.1029/2020EF001502.
- Hasebe, T., 2013. Copula-based maximum-likelihood estimation of sample-selection models. The Stata Journal, 13 (3), 547–573. doi:10.1177/1536867X1301300307.
- Hayes, M.J., et al., 1999. Monitoring the 1996 drought using the standardized precipitation index. Bulletin of the American Meteorological Society, 80 (3), 429–438. doi:10.1175/1520-0477(1999)080<0429:MTDUTS>2.0.CO;2.
- He, B., et al., 2019. CAS FGOALS-f3-L model datasets for CMIP6 historical atmospheric model Intercomparison project simulation. Advances in Atmospheric Sciences, 36 (8), 771–778. doi:10.1007/s00376-019-9027-8.
- Karandish, F. and Hoekstra, A., 2017. Informing national food and water security policy through water footprint assessment: the case of Iran. Water, 9 (11), 831. doi:10.3390/w9110831.
- Katiraie‐Boroujerdy, P., et al., 2019. Assessment of seven CMIP5 model precipitation extremes over Iran based on a satellite‐based climate data set. International Journal of Climatology, 39 (8), 3505–3522. doi:10.1002/joc.6035.
- Krasting, J.P., et al., 2018. Noaa-gfdl gfdl-esm4 model output prepared for cmip6 cmip historical.
- Kuswanto, H., et al., 2021. Drought analysis in East Nusa Tenggara (Indonesia) using regional frequency analysis. The Scientific World Journal, 2021, 1–10. doi:10.1155/2021/6626102.
- Lee, D., et al., 2020. Future runoff analysis in the Mekong river basin under a climate change scenario using deep learning. Water (Switzerland), 12 (6), 1–19.
- Liao, E., et al., 2021. Future weakening of the ENSO ocean carbon buffer under anthropogenic forcing. Geophysical Research Letters, 48 (18), e2021GL094021. doi:10.1029/2021GL094021.
- Lim Kam Sian, K.T.C., et al., 2021. Multi-decadal variability and future changes in precipitation over Southern Africa. Atmosphere, 12 (6), 742. doi:10.3390/atmos12060742.
- Liu, D., Nosovskiy, G.V., and Sourina, O., 2008. Effective clustering and boundary detection algorithm based on Delaunay triangulation. Pattern Recognition Letters, 29 (9), 1261–1273. doi:10.1016/j.patrec.2008.01.028.
- Lovato, T. and Peano, D., 2020. CMCC CMCC-CM2-SR5 model output prepared for CMIP6 CMIP historical. Earth System Grid Federation.
- McKee, T.B., Doesken, N.J., and Kleist, J., 1993. The relationship of drought frequency and duration to time scales. Proceedings of the 8th Conference on Applied Climatology, 17 (22), 179–183.
- Mesbahzadeh, T., et al., 2019. Joint modeling of precipitation and temperature using copula theory for current and future prediction under climate change scenarios in arid lands (case study, Kerman Province, Iran). Advances in Meteorology, 2019, 1–15. doi:10.1155/2019/6848049
- Nelsen, R.B., 2006. An introduction to copulas. Portland, USA: Springer Science & Business Media.
- Noori, R., et al., 2021. Anthropogenic depletion of Iran’s aquifers. Proceedings of the National Academy of Sciences, 118 (25), e2024221118. doi:10.1073/pnas.2024221118.
- O’Neill, B.C., et al., 2017. The roads ahead: narratives for shared socioeconomic pathways describing world futures in the 21st century. Global Environmental Change, 42, 169–180. doi:10.1016/j.gloenvcha.2015.01.004
- Pak, G., et al., 2021. Korea institute of ocean science and technology earth system model and its simulation characteristics. Ocean Science Journal, 56 (1), 18–45. doi:10.1007/s12601-021-00001-7.
- Park, S. and Shin, J., 2019. SNU SAM0-UNICON model output prepared for CMIP6 CMIP historical. Seoul, South Korea: Earth System Grid Federation.
- Peano, D., Lovato, T., and Materia, S., 2020. CMCC CMCC-ESM2 model output prepared for CMIP6 LS3MIP. France: Earth System Grid Federation. doi:10.22033/ESGF/CMIP6.13165.
- Peres, D.J., et al., 2023. A dynamic approach for assessing climate change impacts on drought: an analysis in Southern Italy. Hydrological Sciences Journal, 68.9, 1213–1228.
- Qiu, J., Shen, Z., and Xie, H., 2023. Drought impacts on hydrology and water quality under climate change. Science of the Total Environment, 858, 159854. doi:10.1016/j.scitotenv.2022.159854.
- Raghavan, K. and Panickal, S., 2019. CCCR-IITM IITM-ESM model output prepared for CMIP6 CMIP piControl. India: Earth System Grid Federation.
- Raymond, C., et al., 2020. Understanding and managing connected extreme events. Nature Climate Change, 10 (7), 611–621. doi:10.1038/s41558-020-0790-4.
- Raziei, T., 2021. Performance evaluation of different probability distribution functions for computing standardized precipitation index over diverse climates of Iran. International Journal of Climatology, 41 (5), 3352–3373. doi:10.1002/joc.7023.
- Raziei, T., 2022. Climate of Iran according to Köppen-Geiger, Feddema, and UNEP climate classifications. Theoretical and Applied Climatology, 148 (3–4), 1395–1416. doi:10.1007/s00704-022-03992-y.
- Reddy, M.J. and Ganguli, P., 2012. Bivariate flood frequency analysis of upper Godavari River flows using archimedean copulas. Water Resources Management, 26 (14), 3995–4018. doi:10.1007/s11269-012-0124-z.
- Ridley, J., et al., 2019. MOHC HadGEM3-GC31-LL model output prepared for CMIP6 CMIP historical. Earth System Grid Federation. doi:10.22033/ESGF/CMIP6.6109.
- Saemian, P., et al., 2022. How much water did Iran lose over the last two decades? Journal of Hydrology: Regional Studies, 41, 101095.
- Sangelantoni, L., Russo, A., and Gennaretti, F., 2019. Impact of bias correction and downscaling through quantile mapping on simulated climate change signal: a case study over Central Italy. Theoretical and Applied Climatology, 135 (1–2), 725–740. doi:10.1007/s00704-018-2406-8.
- Scoccimarro, E.,et al. 2022. Extreme events representation in CMCC-CM2 standard and high-resolution general circulation models. Geoscientific Model Development, 15, 1841–1854. doi:10.5194/gmd-15-1841-2022.
- Seidler, R., et al., 2018. Progress on integrating climate change adaptation and disaster risk reduction for sustainable development pathways in South Asia: evidence from six research projects. International Journal of Disaster Risk Reduction, 31, 92–101. doi:10.1016/j.ijdrr.2018.04.023.
- Sepulchre, P., et al., 2020. IPSL-CM5A2–an earth system model designed for multi-millennial climate simulations. Geoscientific Model Development, 13 (7), 3011–3053. doi:10.5194/gmd-13-3011-2020.
- Shi, X., et al., 2020. Early-holocene simulations using different forcings and resolutions in AWI-ESM. The Holocene, 30 (7), 996–1015. doi:10.1177/0959683620908634.
- Shiau, J.T., 2006. Fitting drought duration and severity with two-dimensional copulas. Water Resources Management, 20 (5), 795–815. doi:10.1007/s11269-005-9008-9.
- Srinivas, S., Menon, D., and Meher Prasad, A., 2006. Multivariate simulation and multimodal dependence modeling of vehicle axle weights with copulas. Journal of Transportation Engineering, 132 (12), 945–955. doi:10.1061/(ASCE)0733-947X(2006)132:12(945).
- Swart, N.C., et al., 2019. The Canadian earth system model version 5 (CanESM5. 0.3). Geoscientific Model Development, 12 (11), 4823–4873. doi:10.5194/gmd-12-4823-2019.
- Tang, Y.,et al., 2023. MOHC UKESM1.0-LL model output prepared for CMIP6 CMIP. World Data Center for Climate (WDCC) at DKRZ. https://www.wdc-climate.de/ui/entry?acronym=C6CMMOU0 .
- Tripathy, K.P., et al., 2023. Climate change will accelerate the high-end risk of compound drought and heatwave events. Proceedings of the National Academy of Sciences, 120 (28), e2219825120. doi:10.1073/pnas.2219825120.
- Ukkola, A.M., et al., 2020. Robust future changes in meteorological drought in CMIP6 projections despite uncertainty in precipitation. Geophysical Research Letters, 47 (11), e2020GL087820. doi:10.1029/2020GL087820.
- Vaghefi, S.A., et al., 2019. The future of extreme climate in Iran. Scientific Reports, 9 (1), 1–11. doi:10.1038/s41598-018-37186-2.
- van Noije, T., et al., 2021. EC-Earth3-AerChem: a global climate model with interactive aerosols and atmospheric chemistry participating in CMIP6. Geoscientific Model Development, 14 (9), 5637–5668. doi:10.5194/gmd-14-5637-2021.
- Voldoire, A., et al., 2019. Evaluation of CMIP6 deck experiments with CNRM‐CM6‐1. Journal of Advances in Modeling Earth Systems, 11 (7), 2177–2213. doi:10.1029/2019MS001683.
- Wang, Y., et al., 2021. Performance of the Taiwan earth system model in simulating climate variability compared with observations and CMIP6 model simulations. Journal of Advances in Modeling Earth Systems, 13 (7), e2020MS002353. doi:10.1029/2020MS002353.
- Westley, K., et al., 2023. Climate change and coastal archaeology in the Middle East and North Africa: assessing past impacts and future threats. The Journal of Island and Coastal Archaeology, 18 (2), 251–283. doi:10.1080/15564894.2021.1955778.
- Won, J., et al., 2020. Copula-based joint drought index using SPI and EDDI and its application to climate change. Science of the Total Environment, 744, 140701. doi:10.1016/j.scitotenv.2020.140701.
- Wu, T., et al., 2018. BCC BCC-CSM2MR model output prepared for CMIP6 CMIP historical. Earth System Grid Federation, 10.
- Xin, X., et al., 2021. Impact of higher resolution on precipitation over China in CMIP6 HighResMIP models. Atmosphere, 12 (6), 762. doi:10.3390/atmos12060762.
- Yang, X., et al., 2018. Bias correction of historical and future simulations of precipitation and temperature for China from CMIP5 models. Journal of Hydrometeorology, 19 (3), 609–623. doi:10.1175/JHM-D-17-0180.1.
- Yousefi, H. and Moridi, A., 2022. Multiobjective optimization of agricultural planning considering climate change impacts: Minab reservoir upstream watershed in Iran. Journal of Irrigation and Drainage Engineering, 148 (4). doi:10.1061/(ASCE)IR.1943-4774.0001675.
- Yukimoto, S., et al., 2019. MRI MRI-ESM2. 0 model output prepared for CMIP6 CMIP historical. Earth System Grid Federation.
- Zamani, Y., et al., 2020. A comparison of CMIP6 and CMIP5 projections for precipitation to observational data: the case of Northeastern Iran. Theoretical and Applied Climatology, 142 (3–4), 1613–1623. doi:10.1007/s00704-020-03406-x.
- Zarenistanak, M., 2019. Historical trend analysis and future projections of precipitation from CMIP5 models in the Alborz mountain area, Iran. Meteorology and Atmospheric Physics, 131 (5), 1259–1280. doi:10.1007/s00703-018-0636-z.
- Zarrin, A. and Dadashi-Roudbari, A., 2021. Projection of future extreme precipitation in Iran based on CMIP6 multi-model ensemble. Theoretical and Applied Climatology, 144 (1–2), 643–660. doi:10.1007/s00704-021-03568-2.
- Zhang, J., 2018. BCC BCC-ESM1 model output prepared for CMIP6 CMIP historical. Earth System Grid Federation.
- Zhang, X., et al., 2011. Indices for monitoring changes in extremes based on daily temperature and precipitation data. Wiley Interdisciplinary Reviews: Climate Change, 2 (6), 851–870.
- Ziehn, T., et al., 2020. The Australian earth system model: ACCESS-ESM1. 5. Journal of Southern Hemisphere Earth Systems Science, 70 (1), 193–214. doi:10.1071/ES19035.
- Zittis, G., et al., 2022. Climate change and weather extremes in the Eastern Mediterranean and Middle East. Reviews of Geophysics, 60 (3), e2021RG000762. doi:10.1029/2021RG000762.