Figures & data
Figure 1. Schematic for heating configuration: conductive approach (first five mice), ultrasound approach (last five mice). See text. SAHUS indicates the Small Animal Hyperthermia Ultrasound System.
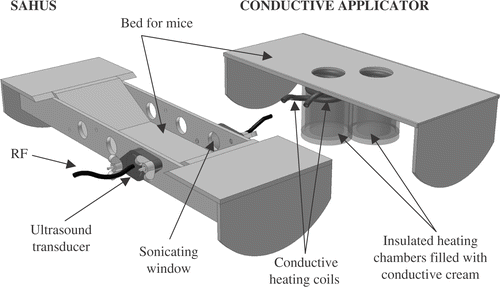
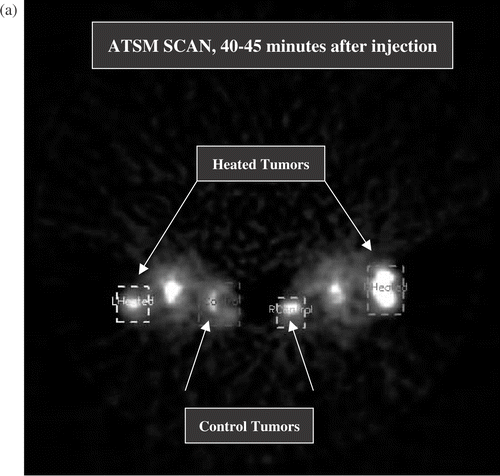
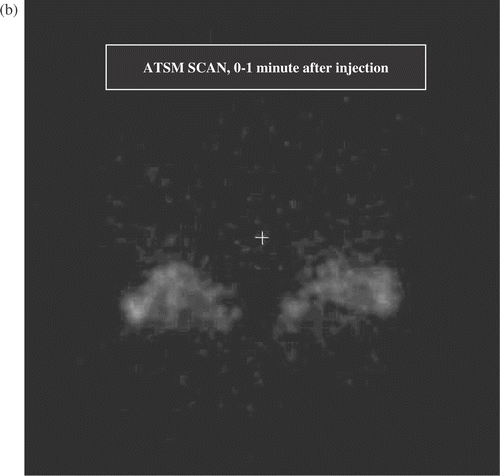
Figure 2. (a) Transverse section from full activity ATSM scan, 5 min average obtained 40–45 min after injection. This image shows two mice at a level that sections through the tumour bearing thighs and the pelvic floor. The lateral thigh tumours are receiving hyperthermia, the medial thigh tumours are unheated controls. The structure between the thigh tumours is the pelvic floor and bladder. Volumes of interest (the heated and control tumours) are displayed. The brightest portions of both control tumours were off this plane, hence the heated tumours display greater uptake in this image. (b) Early ATSM (first minute after injection, 1 min average) for the same two animals shown in (a). (c) Low activity PTSM scan obtained 40–45 min after injection (5 min average) for the same two mice, prior to hyperthermia. Note that the pattern of uptake in the PTSM scan is similar to the early ATSM uptake except for greater early ATSM activity in the two heated tumours, consistent with increased perfusion leading to greater early delivery of radiotracer to the heated tumours.
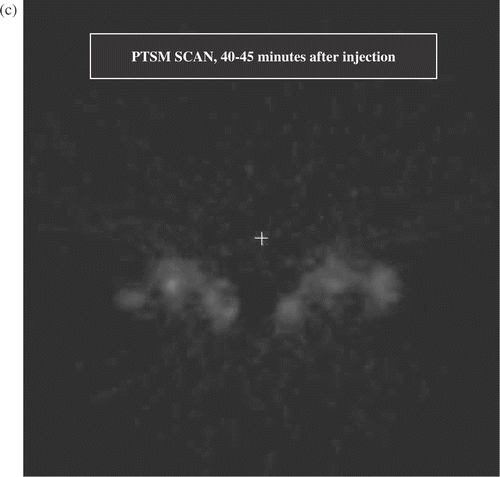
Figure 3. Narrow rectangular region of interest taken through the centre of the heated tumour of the left mouse in . Scan uptake profiles within tumours were compared with needle electrode readings along a track positioned as closely as possible to the image profile.
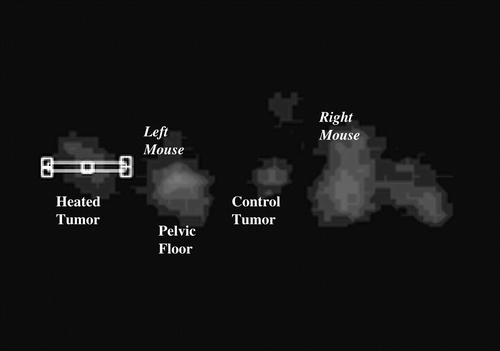
Figure 4. In-vitro uptake of Cu-ATSM for EMT 6 cells under hypoxia (0% O2) and 0.5% O2, with and without hyperthermia. The methodology of Lewis et al. Citation[25] was used. Cell suspensions were continuosly stirred and maintained at target temperature for 45 min, after which radiolabelled Cu-ATSM was added to the suspensions. Target temperature continued to be maintained. Multiple aliquots were taken at t = 1.7, 7.5, 15, 30 min after administration of Cu-ATSM. The cells were pelleted from the media and the percentage uptake (pellet/(pellet + supernatant)) was calculated. Error bars represent standard deviation over three aliquots taken at each time point.
![Figure 4. In-vitro uptake of Cu-ATSM for EMT 6 cells under hypoxia (0% O2) and 0.5% O2, with and without hyperthermia. The methodology of Lewis et al. Citation[25] was used. Cell suspensions were continuosly stirred and maintained at target temperature for 45 min, after which radiolabelled Cu-ATSM was added to the suspensions. Target temperature continued to be maintained. Multiple aliquots were taken at t = 1.7, 7.5, 15, 30 min after administration of Cu-ATSM. The cells were pelleted from the media and the percentage uptake (pellet/(pellet + supernatant)) was calculated. Error bars represent standard deviation over three aliquots taken at each time point.](/cms/asset/cba26c11-c0b1-44c0-a7f0-d690275030d3/ihyt_a_159402_f0004_b.gif)
Figure 5. Activity (in micro Curies) vs. time after administration of 64Cu-ATSM for a typical case. The heated tumour (triangles) shows greater early uptake than the unheated control tumour (squares). This reverses by 4 min.
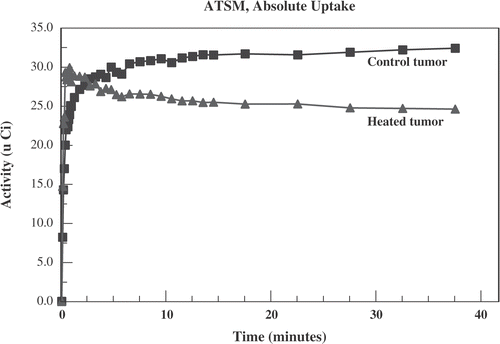
Figure 6. The activity within the chamber of the ventricle vs. time (in units of mCi/cc divided by the total administered activity in mCi). Time t denotes time following administration of 64Cu-ATSM. Displayed data are averaged over all mice ± standard error.
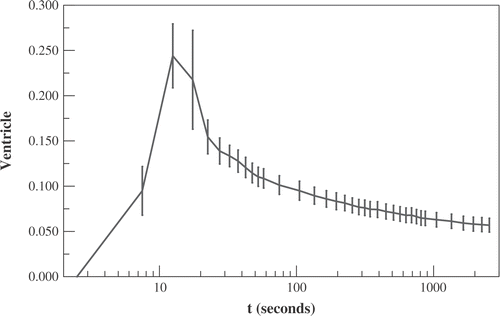
Figure 7. Data from the five mice who underwent low activity Cu-PTSM scans before undergoing hyperthermia and full activity Cu-ATSM scans. The total 64Cu-ATSM uptake averaged over the first minute after administration is compared with the low activity 64Cu-PTSM uptake averaged over a 5 min interval from t = 40–45 min. Uptakes are divided by the total administered activity. Shown are data for the five unheated control tumours (squares) and the last 5 mm of the five animals’ tails (open circles).
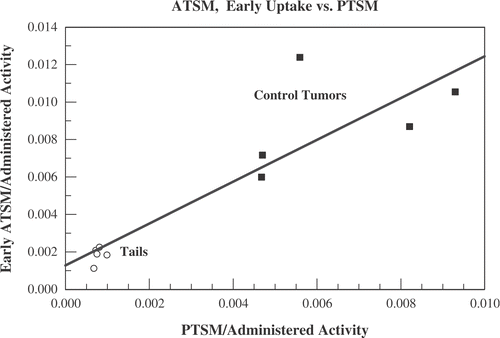
Figure 8. Data for the five tumours heated with ultrasound (same five animals in ). Displayed is the early uptake (averaged over the first 60 s) of 64Cu-ATSM per cc of tumour vs. the steady state ultrasound power needed to maintain temperature at 41.5°C.
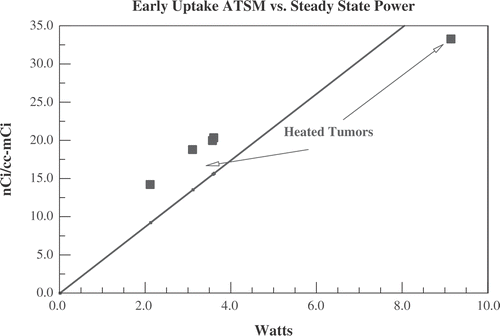
Figure 9. Data from full activity Cu-ATSM scans for all 10 mice. The ‘self-normalized’ activity is defined to be the activity at a given time after administration of radiotracer divided by the average uptake during the first minute after administration. This is intended to correct for greater perfusion (and, therefore, greater delivery of radiotracer) in heated tumours. Displayed are the average self-normalized uptake ± standard error in heated (squares) and control tumours (circles). The heated and control tumours separate by more than the sum of standard errors by 2 min.
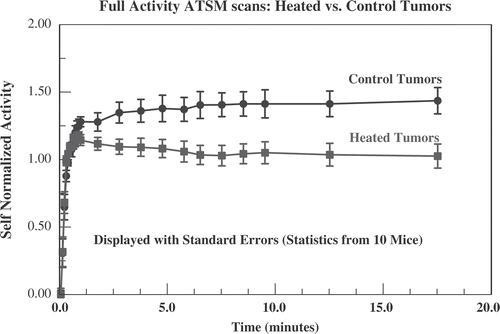
Figure 10. Data from the four animals who had low activity Cu-ATSM scans before heating. The self-normalized uptake (see and text) for the four heated tumours in the full activity Cu-ATSM scan is compared with the self-normalized uptake for the same tumours in the low activity scan, obtained immediately before hyperthermia. Because the number of tumours is smaller, standard errors are larger than in . Also displayed is the self-normalized uptake from the full activity Cu-ATSM scans for all 10 control tumours (reproduced from , standard error omitted for clarity), confirming that, before being heated, these four tumours were comparable to the unheated controls.
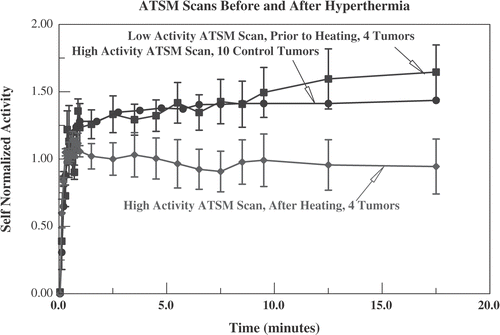
Figure 11. Data from the five mice who had low activity Cu-PTSM scans before heating and full activity Cu-ATSM scans. Self-normalized (see , text) uptake for Cu-PTSM (averaged over 10 tumours, five mice) is compared with Cu-ATSM uptake in the five heated and control tumours. In-vitro studies show that radiotracer from Cu-PTSM is retained at the same level as Cu-ATSM in hypoxic cells but, unlike Cu-ATSM, that level does not drop in well oxygenated cells Citation[25]. This is compatible with greater self-normalized uptake for Cu-PTSM. The heated tumours show the lowest self-normalized activity for Cu-ATSM, consistent with better oxygenation than the controls.
![Figure 11. Data from the five mice who had low activity Cu-PTSM scans before heating and full activity Cu-ATSM scans. Self-normalized (see Figure 9, text) uptake for Cu-PTSM (averaged over 10 tumours, five mice) is compared with Cu-ATSM uptake in the five heated and control tumours. In-vitro studies show that radiotracer from Cu-PTSM is retained at the same level as Cu-ATSM in hypoxic cells but, unlike Cu-ATSM, that level does not drop in well oxygenated cells Citation[25]. This is compatible with greater self-normalized uptake for Cu-PTSM. The heated tumours show the lowest self-normalized activity for Cu-ATSM, consistent with better oxygenation than the controls.](/cms/asset/7274a0b3-802f-4478-9281-6a5e5d4ff829/ihyt_a_159402_f0011_b.gif)
Table I. Comparison of self-normalized uptake of 64Cu-ATSM with pO2 by needle electrode surveys, data from four mice with eight tumours (four heated, four controls), heating by ultrasound. The electrode data represent the average pO2 obtained by successive 1 mm pullbacks over 11–12 points in a single needle track for each tumour, obtained after cessation of scanning and hyperthermia. Self-normalized uptake is averaged over the same number of spatial locations in a thin rectangle set as close as possible to match the needle track. Scan findings obtained during hyperthermia are from low administered activity injections, 30 min into the hyperthermia session. Scan findings after cessation of hyperthermia are from full administered activity injections performed immediately after (right mouse tumours) and 15 min after (left mouse) the end of hyperthermia. Fifteen minutes of image acquisition time was used for each scan and ∼15 min was needed for each electrode survey. Time refers to the initiation of either scan or electrode survey. Standard errors represent scatter over the monitored spatial points.
