Figures & data
Table I. Demographic data and history of 11 patients with recurrent glioblastoma.
Table II. Results of volumetric measurements using Gd-enhanced MRI and FET-PET in 11 patients with recurrent glioblastomas.
Figure 1. A 41-year-old male patient (No. 7) suffering from recurrent glioblastoma in the left temporal lobe. The FET-PET scan (A) shows a larger tumour extension than the corresponding Gd-enhanced MR scan (C); see also the fused image (B). The discrepancies between tumour borders, defined on the PET and MR scans, are shown in the transversal MR image (D) and in the 3D surface-based reconstruction (E). The blue-coloured line/surface marks the MRI-based tumour borders and the rose-coloured line/surface marks the PET-based tumour borders. The green-coloured surface in the image E marks the ventricular system.
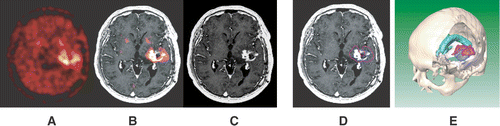
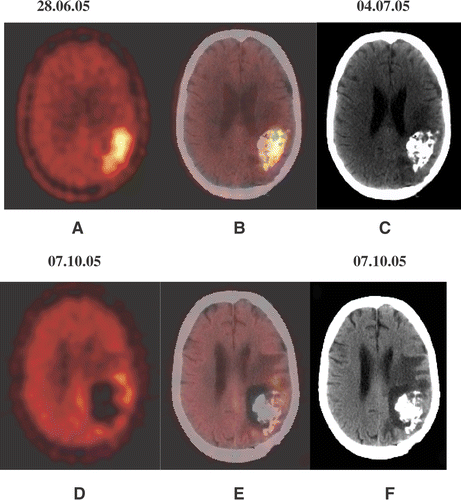
Figure 2. A 44-year-old female patient (No. 6) with recurrent glioblastoma in the left occipital lobe, showing an increased amino acid accumulation (A). CT examination (C), performed 1 day after PET-guided injection of nanoparticles and the fused PET/CT scan (B) allow assessment of their distribution. The control examinations 13 weeks after nano cancer therapy (D–F) show a significant reduction in the amino acid accumulation (PET) and building of necrotic/oedematous zones around the nanoparticles deposits (CT).