411
Views
4
CrossRef citations to date
0
Altmetric
Original

Differential gene expression in peripheral blood lymphocytes of cancer patients treated with whole body hyperthermia and chemotherapy: A pilot study

, MD, , , MD, , , , , & show all
Pages 625-635 | Received 20 Apr 2005, Accepted 18 Oct 2006, Published online: 09 Jul 2009

Figures & data

Table I.  Genes induced by whole body hyperthermia and chemotherapy in peripheral blood lymphocytes of patients with metastatic adenocarcinomas and the reference gene GAPDH.

Figure 1. Dot-blot hybridization of cDNA library enriched for cDNAs upregulated in peripheral blood lymphocytes after whole body hyperthermia probed with PBL cDNAs increased after (after WBH) and before whole body hyperthermia combined with chemotherapy (before WBH), respectively. Marked are clones of cDNAs that are increased ((a)1–3), as well as cDNAs with low (b) and high initial signal intensity (c) that are not differentially expressed.
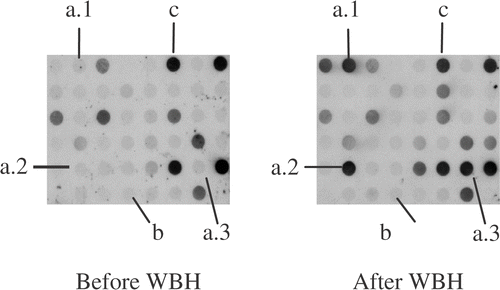
Figure 1. Dot-blot hybridization of cDNA library enriched for cDNAs upregulated in peripheral blood lymphocytes after whole body hyperthermia probed with PBL cDNAs increased after (after WBH) and before whole body hyperthermia combined with chemotherapy (before WBH), respectively. Marked are clones of cDNAs that are increased ((a)1–3), as well as cDNAs with low (b) and high initial signal intensity (c) that are not differentially expressed.

Figure 2. Semi-quantitative RT-PCR (sqRT-PCR) with 1:10 diluted second suppressive PCR material as template generated from combined RNAs from all patients, −: before and +: after WBH with simultaneous chemotherapy, M: 100 bp ladder. Shown are identical cycles for every gene tested. Genes induced are shown (HSP60, HSP90a, HSP90b, HSP105, CacyBP, MIP-1 beta, HBB and the house keeping gene GAPDH for control).
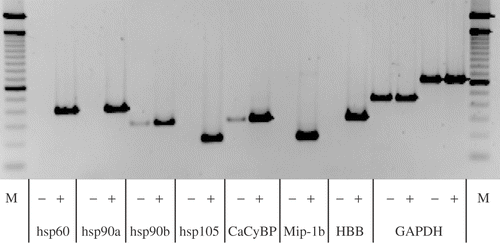
Figure 2. Semi-quantitative RT-PCR (sqRT-PCR) with 1:10 diluted second suppressive PCR material as template generated from combined RNAs from all patients, −: before and +: after WBH with simultaneous chemotherapy, M: 100 bp ladder. Shown are identical cycles for every gene tested. Genes induced are shown (HSP60, HSP90a, HSP90b, HSP105, CacyBP, MIP-1 beta, HBB and the house keeping gene GAPDH for control).

Figure 3. Densitometric evaluation of sqRT-PCR with cDNA of four different patients undergoing WBH and chemotherapy (lymphocyte samples before and after treatment). Shown is the relative increase of expression after therapy (×fold ± SD) of HSP27, HSP60, HSP70, HSP90a, HSP90b, HSP105, CacyBP, MIP-1 beta, HBB.
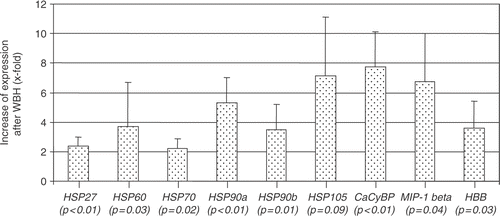
Figure 3. Densitometric evaluation of sqRT-PCR with cDNA of four different patients undergoing WBH and chemotherapy (lymphocyte samples before and after treatment). Shown is the relative increase of expression after therapy (×fold ± SD) of HSP27, HSP60, HSP70, HSP90a, HSP90b, HSP105, CacyBP, MIP-1 beta, HBB.

Reprints and Corporate Permissions

Please note: Selecting permissions does not provide access to the full text of the article, please see our help page How do I view content?

To request a reprint or corporate permissions for this article, please click on the relevant link below:

Academic Permissions

Please note: Selecting permissions does not provide access to the full text of the article, please see our help page How do I view content?

Obtain permissions instantly via Rightslink by clicking on the button below:

If you are unable to obtain permissions via Rightslink, please complete and submit this Permissions form. For more information, please visit our Permissions help page.