Figures & data
Figure 1. (a) Geometry of a 2D ultrasound phased array heating system. This 2D phased array was assumed to be mounted on a positioning system that can shift the array in the x and y directions. The target volume can be divided into several rectangular subregions and then heated sequentially; (b) four types of subregions are formed by using different numbers of scanned focal depths (in dashed regions). The former three were in 1 × 1 cm2 of cross-sectional area with 1, 2, and 3 cm in length, respectively. The fourth case had 1.5 × 1.5 cm2 of cross-sectional area with 3 cm in length.
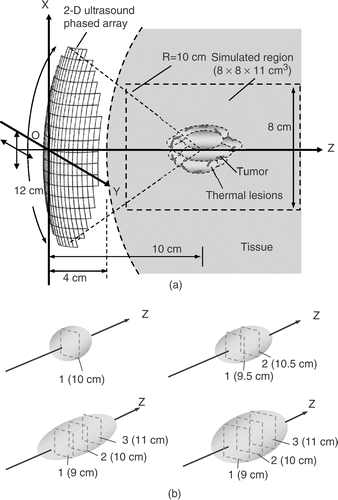
Figure 2. Focal point arrangement of each scanning plane with the scanning areas (a) 1 × 1 cm2 and (b) 1.5 × 1.5 cm2.
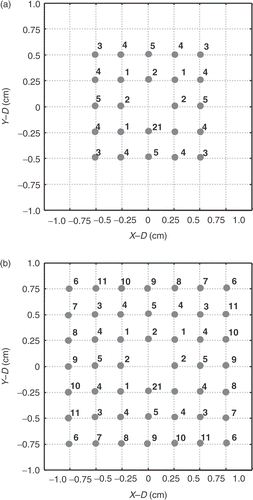
Figure 3. Simulated temperature profiles (using constant/thermal-dependent tissue parameters) compared with the experimental data of a 256-element 2D phased array system Citation[14]. (a) and (b) spatial temperature distribution at the end of sonication (t = 20 s), (c) temperature response at the focal depth (z = 9 cm) and (d) at the pre-focal region (z = 6 cm).
![Figure 3. Simulated temperature profiles (using constant/thermal-dependent tissue parameters) compared with the experimental data of a 256-element 2D phased array system Citation[14]. (a) and (b) spatial temperature distribution at the end of sonication (t = 20 s), (c) temperature response at the focal depth (z = 9 cm) and (d) at the pre-focal region (z = 6 cm).](/cms/asset/7d43f9f9-3397-46b7-8bf6-c80945f2ab9f/ihyt_a_208695_f0003_b.gif)
Figure 4. Three-dimensional surface views of the formed thermal lesions (in TD = 60 and 240 min) to cover subvolumes of (a) 1 × 1 × 1 cm3, (b) 1 × 1 × 2 cm3, (c) 1 × 1 × 3 cm3, (d) 1.5 × 1.5 × 3 cm3 at 1 kg/m3/s of blood perfusion rate and (e) another 1.5 × 1.5 × 3 cm3 subvolume at 10 kg/m3/s.
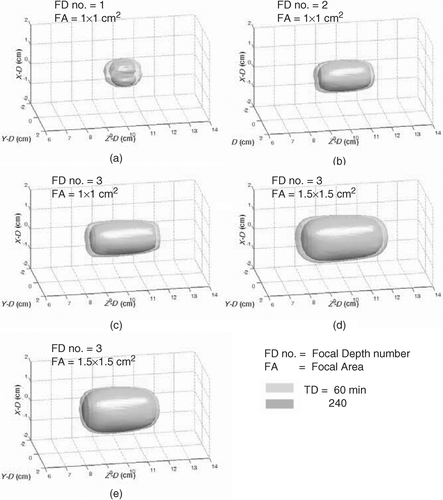
Figure 5. Two-dimensional TD contour distributions (TD = 60 and 240 min were shown) for . Left columns show the X–Z plane (Y = 0 cm) distributions and the right columns show the X–Y plane (Z = 10 cm) distributions. Outer and inner contour for each subplot represent TD = 60 and 240 min, respectively.
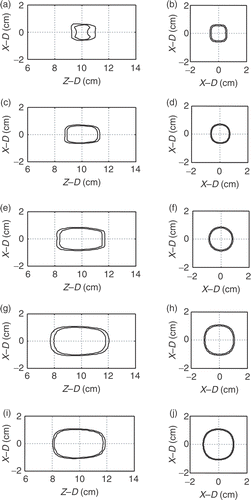
Table I. Comparison of treatment results for different heating units and larger thermal lesions to conform a 3 × 3 × 3 cm3 PTV as well as an irregular PTV.
Figure 6. Three-dimensional surface views of the formed thermal lesions (in TD = 60 and 240 min) in: (a) and (b) two different heating sequences to conform a 3 × 3 × 3 cm3 cubic volume by sequentially heating nine 1 × 1 × 3 cm3 subvolumes at 1 kg/m3/s of blood perfusion rate; (c) and (d) conforming a 3 × 3 × 3 cm3 cubic volume by sequentially heating four 1.5 × 1.5 × 3 cm3 subvolumes at 1 and 10 kg/m3/s of blood perfusion rates, respectively; (e) conforming an irregular volumes by sequentially heating 1 × 1 × 1, 1 × 1 × 2, and 1 × 1 × 3 cm3 subvolumes. The numbers were denoted as the sequence of each subvolume heating, and a 3D cartoon object located at upper-right corner of each subplot represents the shapes and heating unit divisions to the entire target volume.
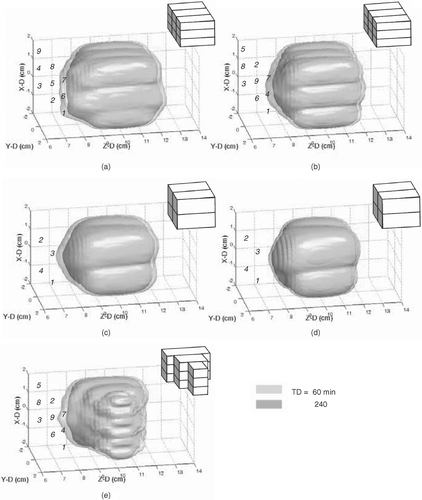
Figure 7. Two-dimensional TD contour distributions (TD = 60 and 240 min were shown) for . Left columns show the X–Z plane (Y = 0 cm) distributions and the right columns show the X–Y plane (Z = 10 cm) distributions. Rectangular regions drawn in dashed lines represent the target volume regions appeared in individual subplots. Outer and inner contour for each subplot represent TD = 60 and 240 min, respectively.
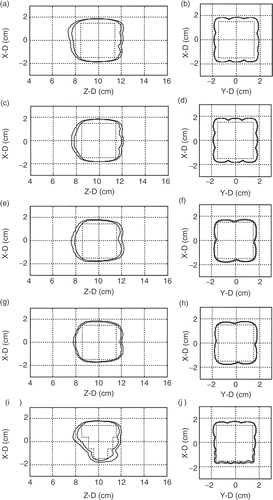
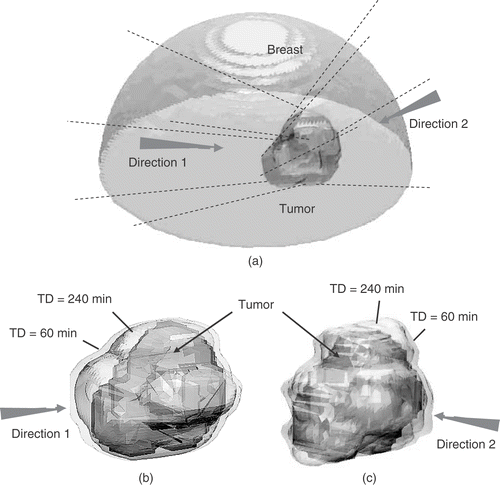
Figure 8. One practical treatment case of an irregular tumor located in female breast: (a) geometrical relation between breast and tumor; (b) and (c) surface views of PTV (pointed out by arrows) and TD = 60 and 240 min iso-surfaces (pointed out by lines) after treatment while using two different power incident directions. Arrows indicate the incident direction of the ultrasonic energy.
