Figures & data
Figure 1. Left: Locoregional hyperthermia treatment of a cervical carcinoma patient with the 70 MHz AMC-4 phased array system; the location of the four antennas is indicated. Right: Schematic representation of the intratumoral and left and right vaginal thermocouple probes in the target region; the anatomical drawing was reprinted from The Northern Cancer Network website (www.cancernorth.nhs.uk).
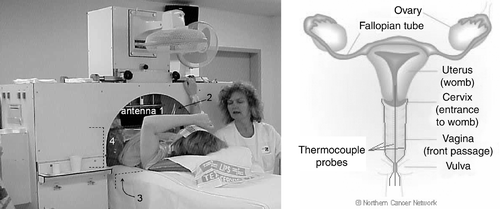
Table I. Dielectric and thermal properties at 70 MHz for the different tissue types used in the calculations; conductivity (σ (S m−1)), relative permittivity (εr (−)), density (ρ (kg m−3)), and specific heat capacity (c (J kg−1°C−1)).
Table II. Overview of all 11 treatment sessions in seven cervical carcinoma patients, in which verification of HTP has been applied. The summarized properties concern the session number, the conditions of the gynaecological tampon, the case as presented below (n.p., not presented), whether a correlation between ΔTmeas and SARcalc was calculated (N, not calculated; Y, calculated), and comments on the encountered difficulties in the verification process.
Table III. Overview of the four presented cases (see ). The summarized properties concern the conditions of the gynaecological tampon, the tissue contact of the catheters (✗ poor contact, ✓ good contact), the presence of power dissipation in the tampon (✗ no dissipation, ✓tissue equivalent dissipation) and its consequence for reliable SAR calculations (SARcalc, ✗ unreliable, ✓ reliable), the quality of the thermal contact of the catheters with tissue (✗ poor thermal contact, ✓ good thermal contact) and its consequence for reliable ΔT measurements (ΔTmeas, ✗ unreliable, ✓ reliable). The last column provides an indication whether all conditions for accurate verification have been fulfilled (✗ not all conditions fulfilled, ✓ conditions fulfilled).
Figure 2. Coronal (panels 1a–4a) and sagittal (panels 1b–4b) cross sections of the CT scans of the patients from cases 1–4. The CT scans were recorded with the patients in treatment position, i.e. supine position, on a waterbolus (w) and mattresses, with the catheters (c) in situ. In some cases (e.g. 3) the gynaecological tampon was too dry, thus some air (a) was present in the (top of the) vagina.
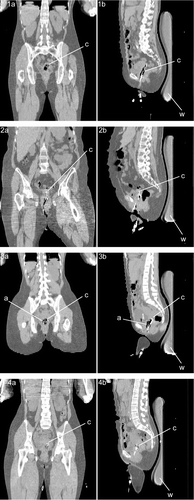
Figure 3. Sagittal cross sections of the segmented anatomy (red: muscle; yellow: fat; orange: tumour; green: bone; blue: (inner) air, water or saline) for the four cases (panels 1a–4a). The calculated SAR distributions (SARcalc) are shown in panels 1b–4b, ranging from 0 W kg−1 (blue) to 50 W kg−1 (red), from 0 to 50 W kg−1, from 0 to 75 W kg−1, and from 0 to 60 W kg−1, respectively. The corresponding calculated temperature rise distributions after 30 s are shown in panels 1c–4c, ranging from 0°C (blue) to 0.75°C (red) for all panels. Note the superficial low temperature rises (∼0°C) due to bolus cooling.
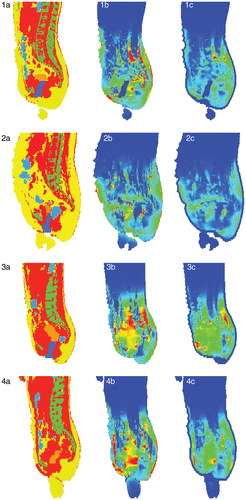
Figure 4. Measured ΔT profiles (ΔTmeas) along the intratumoral, left and right vaginal thermocouple tracks for the four cases (panels 1a–4a). The corresponding calculated SAR profiles (SARcalc) along the intratumoral, left and right vaginal thermocouple tracks are shown in panels 1b–4b.
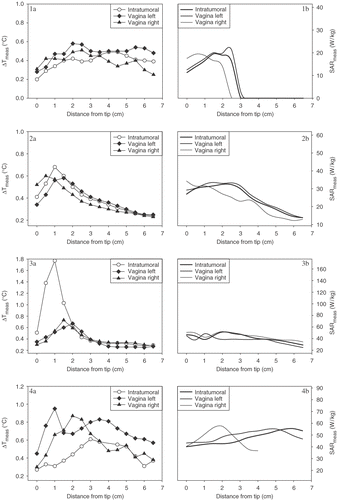
Table IV. Correlations (R) between ΔTmeas and SARcalc for the intratumoral, left and right vaginal thermocouple probes, and the mean ± SD of the three, for the four cases. *p < 0.05, **p < 0.01. For case 1 the correlations were calculated using all thermosensors over the entire length of the thermocouple tracks, or using the thermosensors of the deepest ∼2.5–3 cm only, for which the tissue contact was good (between parentheses).