Figures & data
Figure 1. The thermal enhancement ratio (TER) as a function of time at 41°C. The time at 41°C required to increase the TER significantly varies with different tumor cell lines. The TER is shown for HeLa (solid diamonds), NSY (open squares), HT29 (open circles) and HCT15 (open triangles) cells after various time intervals of heating at 41°C. The TER values were calculated as the average of the dose ratios at 0.1 and 0.01 survival levels after X-irradiation without and with prior hyperthermia.
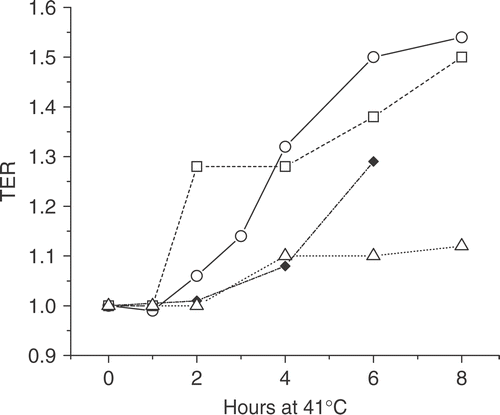
Figure 2. Whole cell MRE11 levels relate to the time at 41°C needed to induce a measurable TER. The MRE11/actin ratios as measured by western blots of whole cell lysates are significantly different between four human tumor cell lines by a Student's t-test (a). The ratios are the average of four blots of separate cell lysates. The p-values are the results of a Student's t-test vs. the ratios observed in HeLa cells. Regression analysis (b) suggests that MRE11 levels within a certain range affect the thermal dose required to induce measurable heat-induced radiosensitization (TER > 1.1) by moderate hyperthermia.
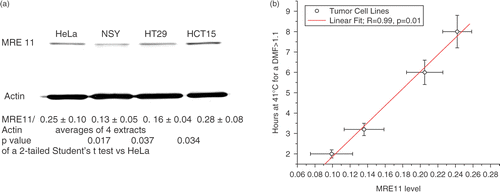
Figure 3. The subcellular distribution of MRE11 during 41°C hyperthermia. MRE11 in tumor cells was localized by immunofluorescence staining after the indicated time intervals at 41°C. (a) HCT15 cells, (b) HeLa cells, (c) NSY cells, (d) HT29 cells. In all panels ‘C’ indicates cells that were not heated.
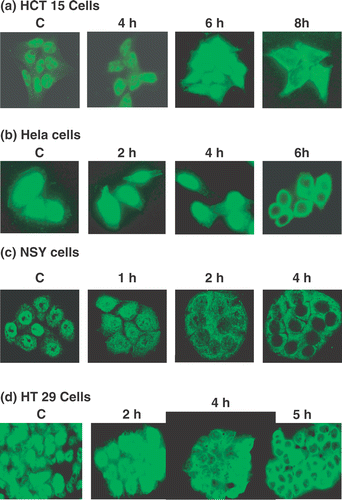
Figure 4. Western blots of the TX100 soluble (SF) and insoluble (ISF) fractions from four human tumor cell lines heated at 41°C. The loss of MRE11 from the ISF and increase in the SF represents the delocalization of MRE11 from the nucleus into the cytoplasm. The indicated tumor cells were heated at 41°C for the indicated time and the TX100 SF and ISF were separated as described in the text. The blots were probed with antibody against MRE11 and actin. Results from a typical experiment are shown.
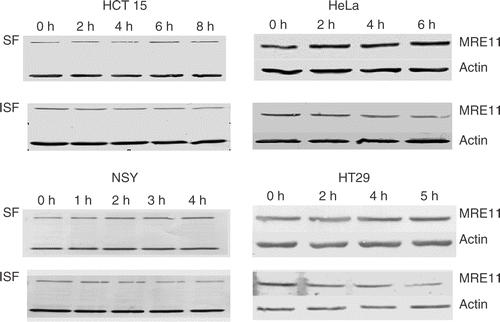
Figure 5. The fractions of MRE11 in the ISF and SF as a function of time at 41°C. Results from three to four separate experiments as shown in were quantified by densitometry as described in the text and averaged. The means, ± 1 SD, are plotted. The fraction of the total cellular MRE11 in the ISF is plotted with closed circles and that in the SF is plotted with open circles.
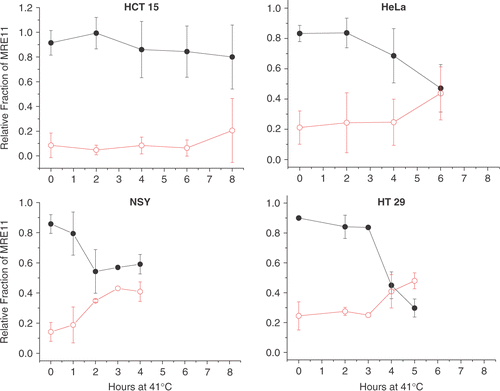
Figure 6. TER as a function of the subcellular localization of MRE11. The TER values from Table I are plotted as a function of the fraction of MRE11 in the ISF (nuclear) in (left panel) and as function of that in the SF (cytoplasmic) (right panel). Data from all four cell lines were included in this analysis. The point marked siRNA was replotted from Xu et al. Citation[18]. The slopes were obtained by linear regression analysis. The data for ISF fractions above 0.85 and SF fractions below 0.15 were excluded from the regression analysis (see text for further discussion).
![Figure 6. TER as a function of the subcellular localization of MRE11. The TER values from Table I are plotted as a function of the fraction of MRE11 in the ISF (nuclear) in Figure 4 (left panel) and as function of that in the SF (cytoplasmic) (right panel). Data from all four cell lines were included in this analysis. The point marked siRNA was replotted from Xu et al. Citation[18]. The slopes were obtained by linear regression analysis. The data for ISF fractions above 0.85 and SF fractions below 0.15 were excluded from the regression analysis (see text for further discussion).](/cms/asset/cc0a45e5-b917-4bcf-ab6a-8cd8d2165b29/ihyt_a_238189_f0006_b.gif)
