613
Views
28
CrossRef citations to date
0
Altmetric
Original

Prostate thermal therapy with high intensity transurethral ultrasound: The impact of pelvic bone heating on treatment delivery

, &
Pages 609-622 | Received 10 Aug 2007, Accepted 13 Oct 2007, Published online: 09 Jul 2009

Figures & data

Figure 1. Generalized schematic of the catheter-based transurethral ultrasound applicator capable of mechanical rotation within an inflatable urethral cooling balloon, with cross-sections of planar, curvilinear, and sectored tubular transducers (Single active 90° sector). Heating profiles for the three transducer types taken from temperature contours during simulated treatments are shown.
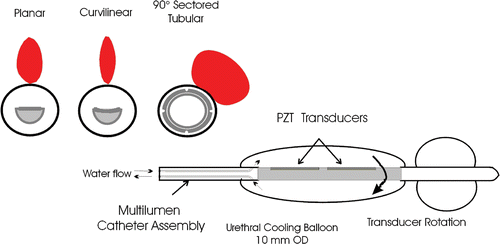
Figure 1. Generalized schematic of the catheter-based transurethral ultrasound applicator capable of mechanical rotation within an inflatable urethral cooling balloon, with cross-sections of planar, curvilinear, and sectored tubular transducers (Single active 90° sector). Heating profiles for the three transducer types taken from temperature contours during simulated treatments are shown.

Figure 2. Transverse CT sections depicting example cases of two seperate patients, one with a 5 cm gland (left) and the other with a 3 cm gland (right), that show the pubic bones in close proximity to the prostate.

Figure 2. Transverse CT sections depicting example cases of two seperate patients, one with a 5 cm gland (left) and the other with a 3 cm gland (right), that show the pubic bones in close proximity to the prostate.

Figure 3. Geometry of the biothermal simulation model with a transurethral ultrasound applicator within the prostatic urethra, the prostate of the variable dimensions the rectum with endorectal cooling, and a simplified representation of pubic bones at variable distance from the prostate capsule. The intended target zone for the simulations is demarcated as a ∼90° sector quadrant of the prostate centered around a peluic bone.
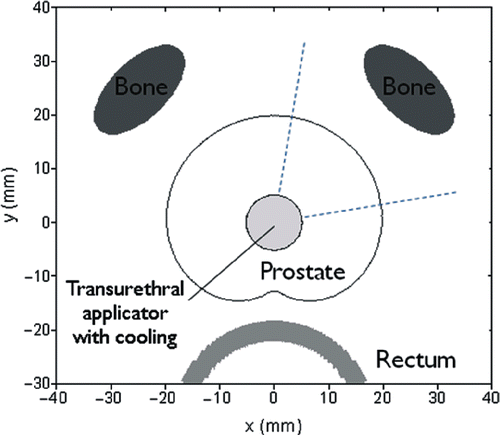
Figure 3. Geometry of the biothermal simulation model with a transurethral ultrasound applicator within the prostatic urethra, the prostate of the variable dimensions the rectum with endorectal cooling, and a simplified representation of pubic bones at variable distance from the prostate capsule. The intended target zone for the simulations is demarcated as a ∼90° sector quadrant of the prostate centered around a peluic bone.

Table I.  Thermal and acoustic parameters used for different tissue types in the simulations.

Figure 4. Snapshots of temperature contour profiles for the curvilinear (a,b,c), planar (d,e,f) and tubular (g,h,i), applicators. The planar and corvilinear devices will sweep and produce temperature elevations along the entire bone surface (arrow indicates direction of sweeping). Bone heating is compared at 10 W with an applicator frequency of 6.5 MHz and bone 1 cm from the prostate (a,d,g) or 2 cm from the prostate (b,e,b) to heating with an applicator frequency of 10 MHz (c,f,i). The 52°C contour is bolded in red. A 48°C bolded contour is shown in green for the sectored tubular applicator at 6.5 MHz (g) at an earlier point when bone temperature is higher.
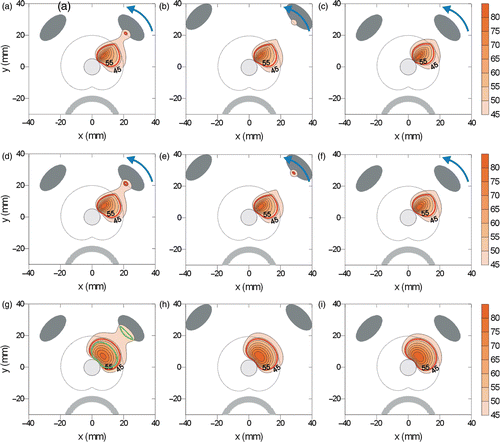
Figure 4. Snapshots of temperature contour profiles for the curvilinear (a,b,c), planar (d,e,f) and tubular (g,h,i), applicators. The planar and corvilinear devices will sweep and produce temperature elevations along the entire bone surface (arrow indicates direction of sweeping). Bone heating is compared at 10 W with an applicator frequency of 6.5 MHz and bone 1 cm from the prostate (a,d,g) or 2 cm from the prostate (b,e,b) to heating with an applicator frequency of 10 MHz (c,f,i). The 52°C contour is bolded in red. A 48°C bolded contour is shown in green for the sectored tubular applicator at 6.5 MHz (g) at an earlier point when bone temperature is higher.

Figure 5. Peak temperatures (a) and maximum cumulative thermal dose (b) at the bone surface for a 3 cm prostate treated with a planar, curvilinear, or tubular applicator at 4–8 W and 8.5–10 MHz.
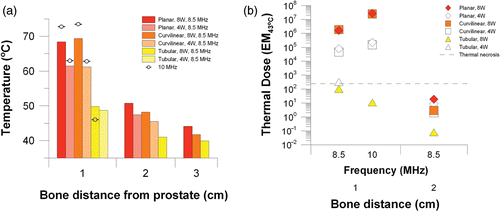
Figure 5. Peak temperatures (a) and maximum cumulative thermal dose (b) at the bone surface for a 3 cm prostate treated with a planar, curvilinear, or tubular applicator at 4–8 W and 8.5–10 MHz.

Figure 6. Peak temperatures (a) and maximum cumulative thermal dose (b) at the bone surface for a 4 cm prostate treated with a planar, curvilinear, or tubular applicator at 4–8 W and 8.5–10 MHz.
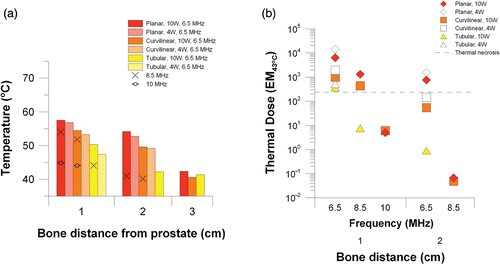
Figure 6. Peak temperatures (a) and maximum cumulative thermal dose (b) at the bone surface for a 4 cm prostate treated with a planar, curvilinear, or tubular applicator at 4–8 W and 8.5–10 MHz.

Figure 7. Peak temperatures (a) and maximum cumulative thermal dose (b) at the bone surface for a 5 cm prostate treated with a planar, curvilinear, or tubular applicator at 4–8 W and 8.5–10 MHz.
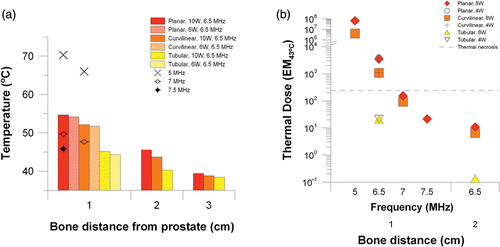
Figure 7. Peak temperatures (a) and maximum cumulative thermal dose (b) at the bone surface for a 5 cm prostate treated with a planar, curvilinear, or tubular applicator at 4–8 W and 8.5–10 MHz.

Table II.  Simulation results comparing power, frequency, and absorption model in their effects on bone temperature, treatment time, and thermal dose with bone 1 cm from the prostate boundary.

Reprints and Corporate Permissions

Please note: Selecting permissions does not provide access to the full text of the article, please see our help page How do I view content?

To request a reprint or corporate permissions for this article, please click on the relevant link below:

Academic Permissions

Please note: Selecting permissions does not provide access to the full text of the article, please see our help page How do I view content?

Obtain permissions instantly via Rightslink by clicking on the button below:

If you are unable to obtain permissions via Rightslink, please complete and submit this Permissions form. For more information, please visit our Permissions help page.