3,245
Views
50
CrossRef citations to date
0
Altmetric
Original

A polyacrylamide gel phantom for radiofrequency ablation

, , , , &
Pages 568-576 | Received 24 Jun 2007, Accepted 04 Apr 2008, Published online: 09 Jul 2009

Figures & data

Table I.  The recipe for phantom with a citrate buffer concentration of 0.2 M and pH of 4.3. (1L).

Figure 1. The cuvette containing the tissue-mimicking phantom for spectrophotometer. (A) fresh transparent phantom (absorbance = 0) and (B) completely coagulated phantom (absorbance = 1).
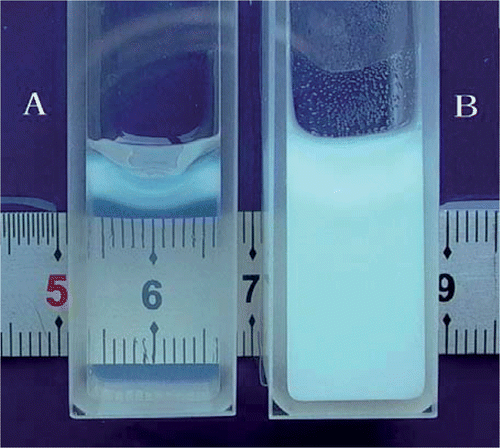
Figure 1. The cuvette containing the tissue-mimicking phantom for spectrophotometer. (A) fresh transparent phantom (absorbance = 0) and (B) completely coagulated phantom (absorbance = 1).

Figure 2. The coagulation temperature (Tc) of the tissue-mimicking phantom increases with pH at the range of 4.2 to 4.8.
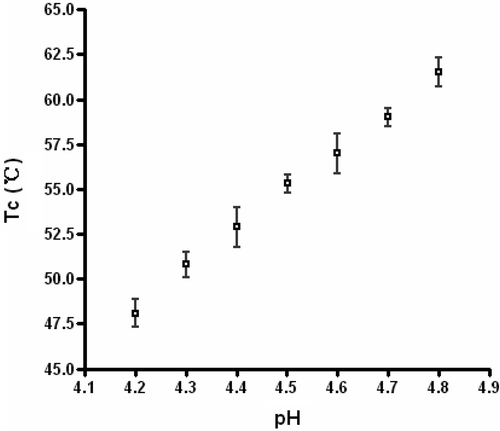
Figure 2. The coagulation temperature (Tc) of the tissue-mimicking phantom increases with pH at the range of 4.2 to 4.8.

Figure 3. (A) Schematic diagram of the tissue-mimicking phantom RFA test system. (B) The picture shows the electrode (RITA StarBurst™ XL electrode, nine prongs) is inserted 2 cm into the phantom and deployed by pushing the piston down the shaft of the electrode with the deployment diameter of 2 cm.
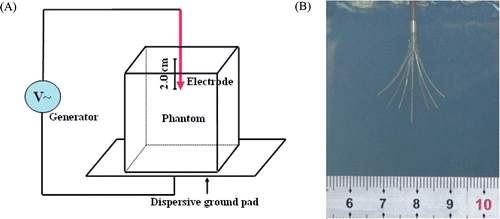
Figure 3. (A) Schematic diagram of the tissue-mimicking phantom RFA test system. (B) The picture shows the electrode (RITA StarBurst™ XL electrode, nine prongs) is inserted 2 cm into the phantom and deployed by pushing the piston down the shaft of the electrode with the deployment diameter of 2 cm.

Table II.  The physical properties of the phantoms and human liver (mean ± SD).

Figure 4. The development of coagulation lesions in tissue-mimicking phantoms (pH = 4.3) during RFA. The pictures show coagulation lesions in phantoms are ivory white regions with well-defined boundary during RFA: (A) The coagulation lesion develops around the tip of the central prong in less than 20 seconds during heating (arrow); (B) More coagulation lesions develop around the prongs after 40 seconds of heating; (C) The coagulation lesions enlarge and merge after 2 minutes of heating; and (D) The coagulation lesions merge into an ellipsoid after 7 minutes of heating.
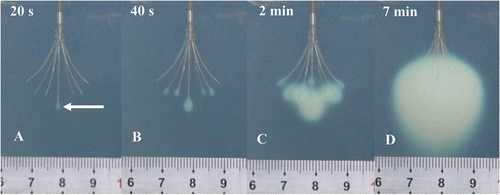
Figure 4. The development of coagulation lesions in tissue-mimicking phantoms (pH = 4.3) during RFA. The pictures show coagulation lesions in phantoms are ivory white regions with well-defined boundary during RFA: (A) The coagulation lesion develops around the tip of the central prong in less than 20 seconds during heating (arrow); (B) More coagulation lesions develop around the prongs after 40 seconds of heating; (C) The coagulation lesions enlarge and merge after 2 minutes of heating; and (D) The coagulation lesions merge into an ellipsoid after 7 minutes of heating.

Figure 5. The coagulation lesions in tissue-mimicking phantoms after 7 minutes of RFA. The ivory white ellipsoid coagulation lesions demonstrate different temperature distribution in different pH phantoms: (A) represents approximately 60°C coagulation lesion (pH 4.7); (B) represents approximately 55°C coagulation lesion (pH 4.5); and (C) represents approximately 50°C coagulation lesion (pH 4.3).
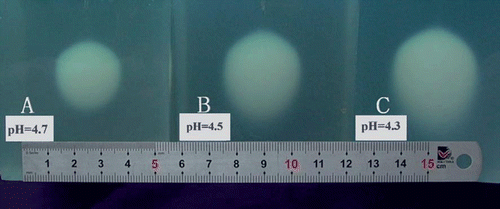
Figure 5. The coagulation lesions in tissue-mimicking phantoms after 7 minutes of RFA. The ivory white ellipsoid coagulation lesions demonstrate different temperature distribution in different pH phantoms: (A) represents approximately 60°C coagulation lesion (pH 4.7); (B) represents approximately 55°C coagulation lesion (pH 4.5); and (C) represents approximately 50°C coagulation lesion (pH 4.3).

Figure 6. Gray-scale ultrasound cannot show the coagulation lesion in tissue mimicking phantom. The air in the electrode hole can shows on the sonogram (arrowhead). As the temperatures approach and exceed 100°C, gray-scale ultrasound can demonstrate the air-echo with a hyperechoic pattern in a heated volume (arrow) immediately after heating.
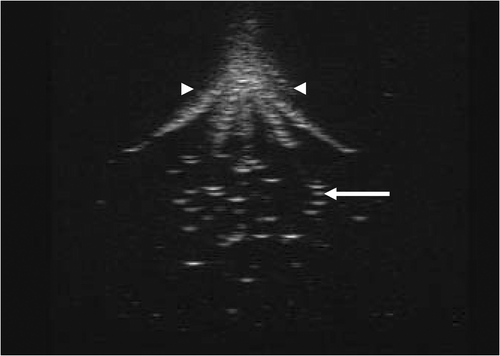
Figure 6. Gray-scale ultrasound cannot show the coagulation lesion in tissue mimicking phantom. The air in the electrode hole can shows on the sonogram (arrowhead). As the temperatures approach and exceed 100°C, gray-scale ultrasound can demonstrate the air-echo with a hyperechoic pattern in a heated volume (arrow) immediately after heating.

Figure 7. The coagulation lesion on the T2-weighted image of MRI has a similar shape and size corresponding to the gross view (pH = 4.5): (A) Coagulation lesion is an ellipsoid with hypo-intensity signal on coronal T2-weighted image of MRI; (B) Gross view of coagulation lesion (front view); (C) Coagulation lesion is a round region with a hypo-intensity signal on the transverse T2-weighted image of MRI; and (D) Gross view of the coagulation lesion (transverse-section).
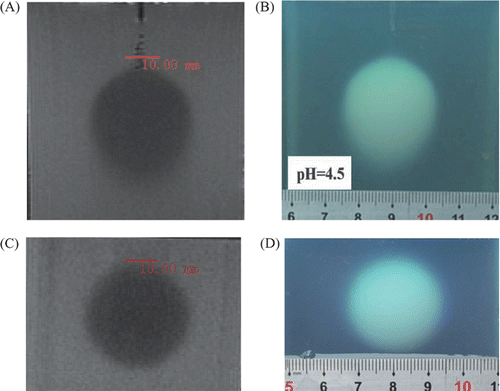
Figure 7. The coagulation lesion on the T2-weighted image of MRI has a similar shape and size corresponding to the gross view (pH = 4.5): (A) Coagulation lesion is an ellipsoid with hypo-intensity signal on coronal T2-weighted image of MRI; (B) Gross view of coagulation lesion (front view); (C) Coagulation lesion is a round region with a hypo-intensity signal on the transverse T2-weighted image of MRI; and (D) Gross view of the coagulation lesion (transverse-section).

Reprints and Corporate Permissions

Please note: Selecting permissions does not provide access to the full text of the article, please see our help page How do I view content?

To request a reprint or corporate permissions for this article, please click on the relevant link below:

Academic Permissions

Please note: Selecting permissions does not provide access to the full text of the article, please see our help page How do I view content?

Obtain permissions instantly via Rightslink by clicking on the button below:

If you are unable to obtain permissions via Rightslink, please complete and submit this Permissions form. For more information, please visit our Permissions help page.