1,030
Views
36
CrossRef citations to date
0
Altmetric
Original

Genes and genetic networks responsive to mild hyperthermia in human lymphoma U937 cells

, PhD, , , , , , & show all
Pages 613-622 | Received 24 Jan 2008, Accepted 19 Apr 2008, Published online: 09 Jul 2009

Figures & data

Table I.  Nucleotide sequences of primers and a probe for target genes.

Figure 1. Effects of hyperthermia on apoptosis in U937 cells. (A) U937 cells were incubated at 37°–44°C for 30 min and then at 37°C for 6 h. DNA fragmentation assay was carried out. Data are presented as mean ± S.D. (n = 3). (B) The cells were incubated at 41° or 43°C for 30 min and then at 37°C for 0–6 h. The phosphatidylserine externalization was examined using the Annexin V-FITC kit. Data are presented as mean ± SD. (n = 3–4).
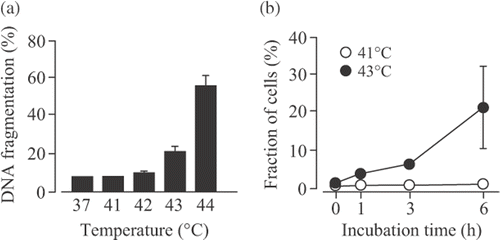
Figure 1. Effects of hyperthermia on apoptosis in U937 cells. (A) U937 cells were incubated at 37°–44°C for 30 min and then at 37°C for 6 h. DNA fragmentation assay was carried out. Data are presented as mean ± S.D. (n = 3). (B) The cells were incubated at 41° or 43°C for 30 min and then at 37°C for 0–6 h. The phosphatidylserine externalization was examined using the Annexin V-FITC kit. Data are presented as mean ± SD. (n = 3–4).

Figure 2. Effects of mild hyperthermia on the protein expression levels of HSPs. U937 cells were incubated at 41°C for 30 min (mild hyperthermia treatment) and then at 37°C for 0.5–6 h. SDS-PAGE and Western blotting were performed. Cont., control (nontreated cells).
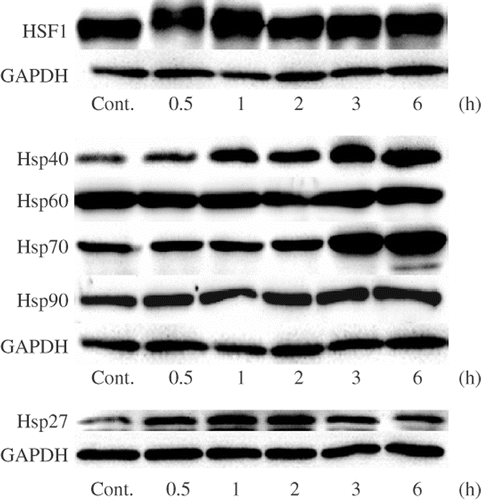
Figure 2. Effects of mild hyperthermia on the protein expression levels of HSPs. U937 cells were incubated at 41°C for 30 min (mild hyperthermia treatment) and then at 37°C for 0.5–6 h. SDS-PAGE and Western blotting were performed. Cont., control (nontreated cells).

Table II.  The top 20 of genes that were up-regulated by heat.

Table III.  The top 20 of genes that were down-regulated by heat.

Table IV.  Genes in functional categories.

Figure 3. Genetic network A. Cells were incubated at 41°C for 30 min (mild hyperthermia treatment) and then at 37°C for 3 h. GeneChip analysis was performed. Probe sets that were differentially expressed were analyzed using Ingenuity Pathways Analysis software. The network is shown graphically as nodes (genes) and edges (the biological relationships between the nodes).
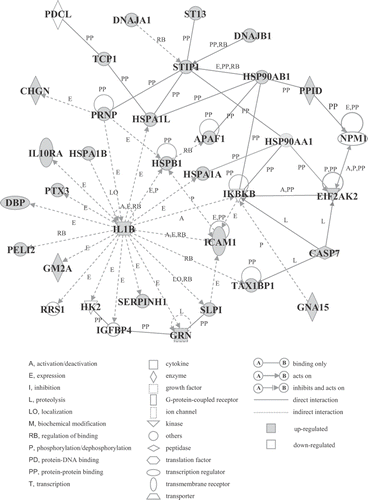
Figure 3. Genetic network A. Cells were incubated at 41°C for 30 min (mild hyperthermia treatment) and then at 37°C for 3 h. GeneChip analysis was performed. Probe sets that were differentially expressed were analyzed using Ingenuity Pathways Analysis software. The network is shown graphically as nodes (genes) and edges (the biological relationships between the nodes).

Figure 4. Genetic network B. Probe sets that were differentially expressed were analyzed using Ingenuity Pathways Analysis software. For the explanation of the symbols and letters, see .
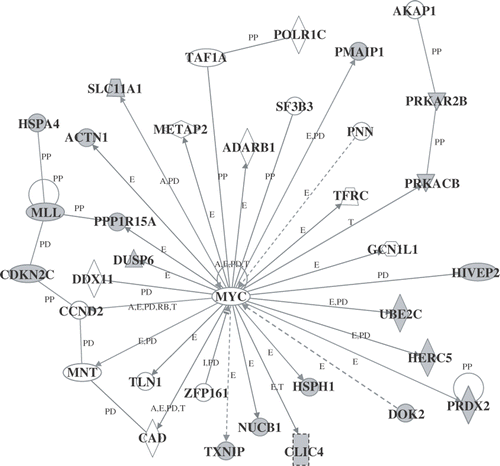
Figure 4. Genetic network B. Probe sets that were differentially expressed were analyzed using Ingenuity Pathways Analysis software. For the explanation of the symbols and letters, see Figure 3.

Figure 5. Verification of microarray results by real-time qPCR assay. Cells were incubated at 41°C for 30 min (mild hyperthermia treatment) and then at 37°C for 1–6 h. Real-time qPCR assay was performed. (A) BAG3; (B) DNAJB1; (C) HSPA1A; (D) HSPA1B; (E) HSPA1L; (F) IL7R; (G) HMOX1; (H) SERPINE1; (I) SERPINH1. Each mRNA expression level was normalized to GAPDH expression level. The shadows indicate mild hyperthermia treatment. Data are presented as mean ± SD. (n = 4).
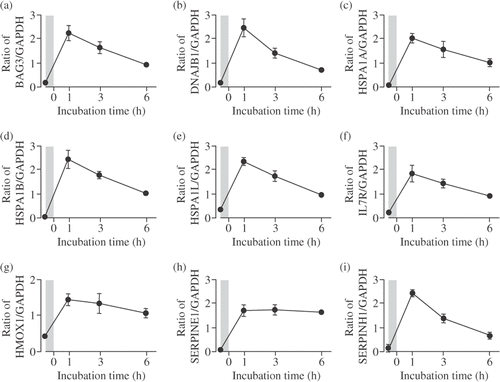
Figure 5. Verification of microarray results by real-time qPCR assay. Cells were incubated at 41°C for 30 min (mild hyperthermia treatment) and then at 37°C for 1–6 h. Real-time qPCR assay was performed. (A) BAG3; (B) DNAJB1; (C) HSPA1A; (D) HSPA1B; (E) HSPA1L; (F) IL7R; (G) HMOX1; (H) SERPINE1; (I) SERPINH1. Each mRNA expression level was normalized to GAPDH expression level. The shadows indicate mild hyperthermia treatment. Data are presented as mean ± SD. (n = 4).

Reprints and Corporate Permissions

Please note: Selecting permissions does not provide access to the full text of the article, please see our help page How do I view content?

To request a reprint or corporate permissions for this article, please click on the relevant link below:

Academic Permissions

Please note: Selecting permissions does not provide access to the full text of the article, please see our help page How do I view content?

Obtain permissions instantly via Rightslink by clicking on the button below:

If you are unable to obtain permissions via Rightslink, please complete and submit this Permissions form. For more information, please visit our Permissions help page.