1,710
Views
93
CrossRef citations to date
0
Altmetric
Original

An in-vivo experimental study of temperature elevations in animal tissue during magnetic nanoparticle hyperthermia

, & , PhD
Pages 589-601 | Received 29 Feb 2008, Accepted 13 May 2008, Published online: 09 Jul 2009

Figures & data

Table I.  Summary of the SAR values found in the literature.

Figure 1. Schematic diagram of the rat, the AC generator, the coil, the temperature measuring path, the data acquisition unit and the theoretical model of the rat limb using an inverse heat transfer analysis.
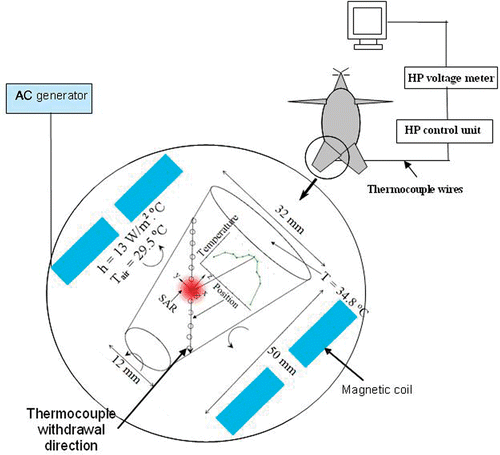
Figure 1. Schematic diagram of the rat, the AC generator, the coil, the temperature measuring path, the data acquisition unit and the theoretical model of the rat limb using an inverse heat transfer analysis.

Figure 2. Experimental setup consists of an RF generator and a coil. The rat was placed on a platform and its limb was positioned so that the injection site was located at the center of the magnetic field. The limb was surrounding by ambient air during the experiment.
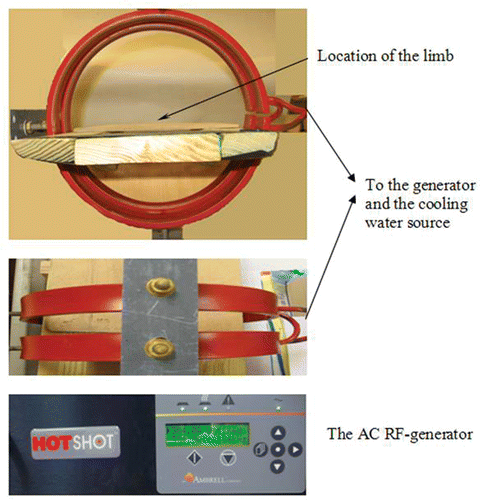
Figure 2. Experimental setup consists of an RF generator and a coil. The rat was placed on a platform and its limb was positioned so that the injection site was located at the center of the magnetic field. The limb was surrounding by ambient air during the experiment.

Figure 3. The temperature change recorded by the thermocouple inserted in the middle of the limb. The vertical arrow represents the time when the steady state was established. After that, temperature measurements along the tissue path were performed.
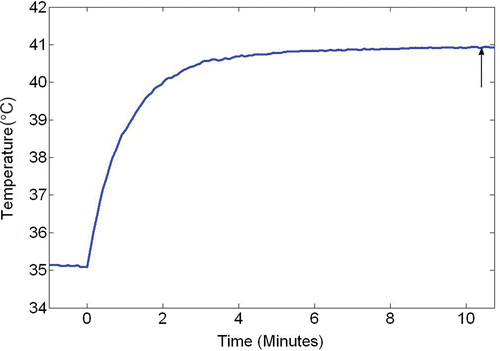
Figure 3. The temperature change recorded by the thermocouple inserted in the middle of the limb. The vertical arrow represents the time when the steady state was established. After that, temperature measurements along the tissue path were performed.

Figure 4. The measured temperature elevations above the core temperature as a function of the measured blood flow rate of the femoral artery.
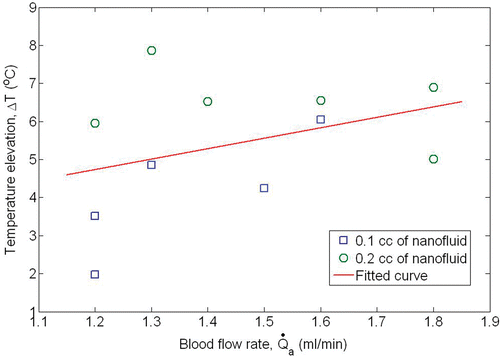
Figure 4. The measured temperature elevations above the core temperature as a function of the measured blood flow rate of the femoral artery.

Table II.  A summary of the measured variables.

Figure 5. The measured distribution of the temperature elevations above the core temperature along the tissue path inside the limb when (a) 0.1 cc and (b) 0.2 cc of ferrofluid were injected. Lines represent different rats.
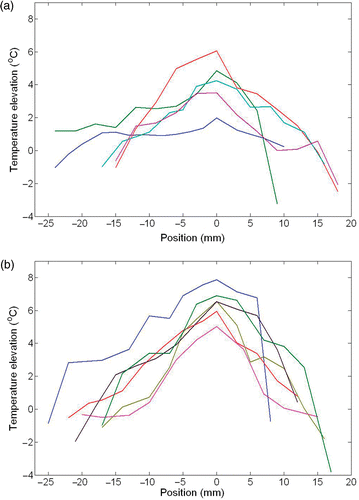
Figure 5. The measured distribution of the temperature elevations above the core temperature along the tissue path inside the limb when (a) 0.1 cc and (b) 0.2 cc of ferrofluid were injected. Lines represent different rats.

Figure 6. Non-dimensional temperature distribution along the tissue path (T*) for different rats when (a) 0.1 cc and (b) 0.2 cc of ferrofluid were injected.
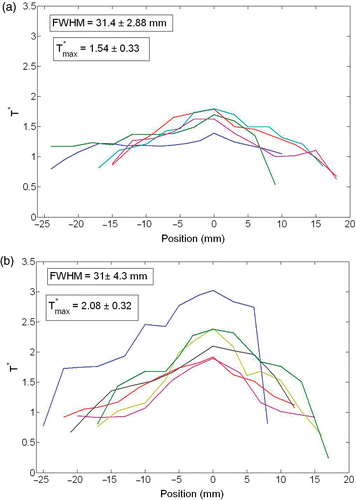
Figure 6. Non-dimensional temperature distribution along the tissue path (T*) for different rats when (a) 0.1 cc and (b) 0.2 cc of ferrofluid were injected.

Figure 7. Averaged temperature measurements at various tissue site (symbol with error bar) and curve fit (line) using the inverse heat transfer analysis. (a) 0.1 cc and (b) 0.2 cc ferrofluid.
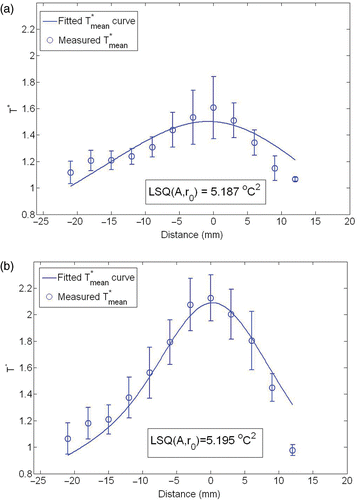
Figure 7. Averaged temperature measurements at various tissue site (symbol with error bar) and curve fit (line) using the inverse heat transfer analysis. (a) 0.1 cc and (b) 0.2 cc ferrofluid.

Figure 8. The convergence curves of A, r0 and the least square objection function obtained by the Nelder-Mead Simplex method. A and r0 were normalized by the initial guess of 50 kW/m3 and 3.5 mm respectively. (a) 0.1 cc and (b) 0.2 cc ferrofluid.
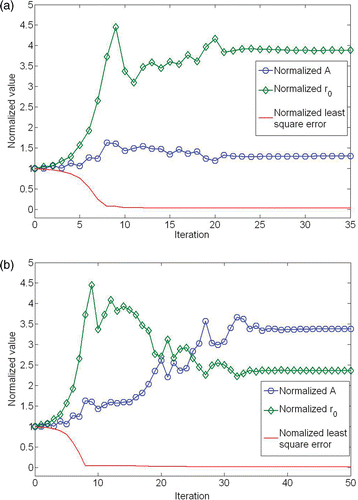
Figure 8. The convergence curves of A, r0 and the least square objection function obtained by the Nelder-Mead Simplex method. A and r0 were normalized by the initial guess of 50 kW/m3 and 3.5 mm respectively. (a) 0.1 cc and (b) 0.2 cc ferrofluid.

Table III.  The calculated values of A and r0 based on the inverse heat transfer problem.

Reprints and Corporate Permissions

Please note: Selecting permissions does not provide access to the full text of the article, please see our help page How do I view content?

To request a reprint or corporate permissions for this article, please click on the relevant link below:

Academic Permissions

Please note: Selecting permissions does not provide access to the full text of the article, please see our help page How do I view content?

Obtain permissions instantly via Rightslink by clicking on the button below:

If you are unable to obtain permissions via Rightslink, please complete and submit this Permissions form. For more information, please visit our Permissions help page.