393
Views
9
CrossRef citations to date
0
Altmetric
Original

Relation between body size and temperatures during locoregional hyperthermia of oesophageal cancer patients

, PhD, , , , , & show all
Pages 663-674 | Received 11 Jan 2008, Accepted 16 May 2008, Published online: 09 Jul 2009

Figures & data

Figure 1. Left: Transversal slice of a CT scan of an oesophageal cancer patient, made in treatment position, i.e. in prone position on a water bolus. The tumour was outlined by a radiation oncologist. The dorsoventral (AP) and lateral (LAT) diameters, as well as the thickness of the dorsal, ventral, left and right fat layers were measured at mid-tumoural level. Right: Schematic drawing of the patient's cross section based on the diameters and fat layer thickness as determined from the CT scan, used to estimate the fat percentage.
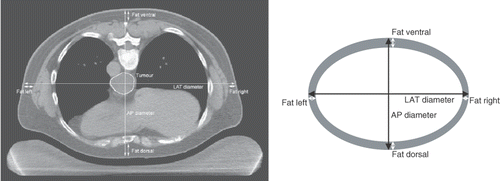
Figure 1. Left: Transversal slice of a CT scan of an oesophageal cancer patient, made in treatment position, i.e. in prone position on a water bolus. The tumour was outlined by a radiation oncologist. The dorsoventral (AP) and lateral (LAT) diameters, as well as the thickness of the dorsal, ventral, left and right fat layers were measured at mid-tumoural level. Right: Schematic drawing of the patient's cross section based on the diameters and fat layer thickness as determined from the CT scan, used to estimate the fat percentage.

Figure 2. (a) Example of the estimation of effective perfusion from tumour temperature measurements during the 2-min cool-down period following the 60-min steady-state period. (b) The temperature decrease during the cool-down period was fitted with an exponential decay (Equation 5), from which the effective perfusion was determined according to Equation 7.
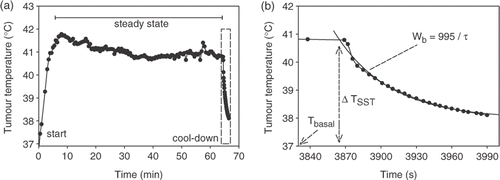
Figure 2. (a) Example of the estimation of effective perfusion from tumour temperature measurements during the 2-min cool-down period following the 60-min steady-state period. (b) The temperature decrease during the cool-down period was fitted with an exponential decay (Equation 5), from which the effective perfusion was determined according to Equation 7.

Figure 3. Average tumour temperatures, quantified by T90, T50 and T10, classified by the different pathological responses. CR, complete remission (n = 5); mPR, partial remission with only residual microscopic tumour foci (n = 7); PR, partial remission (n = 9); StD, stable disease (n = 6). Data are mean ± SEM.
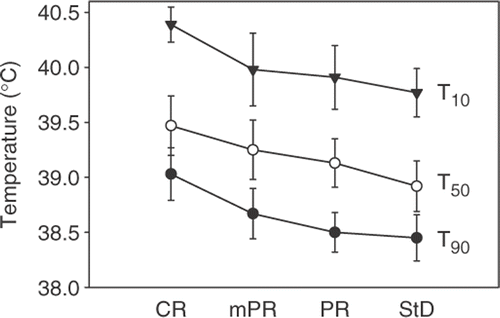
Figure 3. Average tumour temperatures, quantified by T90, T50 and T10, classified by the different pathological responses. CR, complete remission (n = 5); mPR, partial remission with only residual microscopic tumour foci (n = 7); PR, partial remission (n = 9); StD, stable disease (n = 6). Data are mean ± SEM.

Table I.  Patients characteristics and hyperthermia treatment results for all 29 patients.

Figure 4. (a) Relation between median tumour temperature (T50) and dorsoventral (AP) diameter. (b) Relation between T50 and lateral (LAT) diameter. (c) Relation between T50 and body mass. All relations were fitted with first order inverse functions (lines). Rfit² was 0.23 (a), 0.38 (b) and 0.45 (c).

Figure 4. (a) Relation between median tumour temperature (T50) and dorsoventral (AP) diameter. (b) Relation between T50 and lateral (LAT) diameter. (c) Relation between T50 and body mass. All relations were fitted with first order inverse functions (lines). Rfit² was 0.23 (a), 0.38 (b) and 0.45 (c).

Figure 5. (a) Relation between median tumour temperature (T50) and thickness of dorsoventral (AP) fat layers. (b) Relation between T50 and thickness of lateral (LAT) fat layers. (c) Relation between T50 and estimated fat percentage. All relations were fitted with first order inverse functions (lines). Rfit² was 0.27 (a), 0.38 (b) and 0.27 (c).

Figure 5. (a) Relation between median tumour temperature (T50) and thickness of dorsoventral (AP) fat layers. (b) Relation between T50 and thickness of lateral (LAT) fat layers. (c) Relation between T50 and estimated fat percentage. All relations were fitted with first order inverse functions (lines). Rfit² was 0.27 (a), 0.38 (b) and 0.27 (c).

Figure 6. (a) Relation between systemic temperature rise and body mass. The depicted curves (dashed lines) represent the inverse relations ΔTsyst = 110/m and ΔTsyst = 55/m (see text). (b) Relation between median tumour temperature (T50) and systemic temperature rise. Relation was fitted with a linear function (solid line). Rfit² was 0.45.
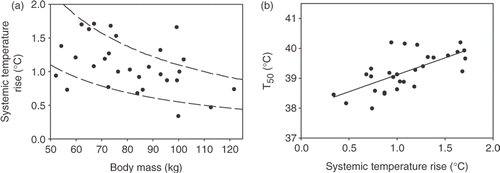
Figure 6. (a) Relation between systemic temperature rise and body mass. The depicted curves (dashed lines) represent the inverse relations ΔTsyst = 110/m and ΔTsyst = 55/m (see text). (b) Relation between median tumour temperature (T50) and systemic temperature rise. Relation was fitted with a linear function (solid line). Rfit² was 0.45.

Figure 7. (a) Relation between median tumour temperature (T50) and effective perfusion, as determined from the temperature decay at the end of the hyperthermia treatment. (b) Relation between systemic temperature rise and effective perfusion. Both relations were fitted with first order inverse functions (lines). Rfit² was 0.10 (a) and 0.01 (b).
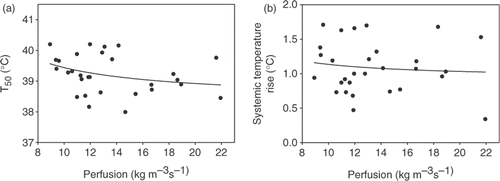
Figure 7. (a) Relation between median tumour temperature (T50) and effective perfusion, as determined from the temperature decay at the end of the hyperthermia treatment. (b) Relation between systemic temperature rise and effective perfusion. Both relations were fitted with first order inverse functions (lines). Rfit² was 0.10 (a) and 0.01 (b).

Table II.  Univariate correlations between parameters for all 29 patients (*p < 0.05, **p < 0.01).

Table III.  Multivariate correlation analysis for the three parameters that most strongly determined tumour temperatures, for all 29 patients (*p < 0.05, **p < 0.01). For comparison the univariate correlations for the concerned parameters have been reprinted from . The sum of the partial correlations squared (ΣR2) quantifies the amount of the variance in the temperatures that is explained by the three parameters. For comparison a pseudo-ΣR2 is given for the univariate correlations.

Reprints and Corporate Permissions

Please note: Selecting permissions does not provide access to the full text of the article, please see our help page How do I view content?

To request a reprint or corporate permissions for this article, please click on the relevant link below:

Academic Permissions

Please note: Selecting permissions does not provide access to the full text of the article, please see our help page How do I view content?

Obtain permissions instantly via Rightslink by clicking on the button below:

If you are unable to obtain permissions via Rightslink, please complete and submit this Permissions form. For more information, please visit our Permissions help page.