461
Views
12
CrossRef citations to date
0
Altmetric
Original

Effects of hyperthermia with dextran magnetic fluid on the growth of grafted H22 tumor in mice

, &
Pages 65-71 | Received 16 Apr 2008, Accepted 22 Jul 2008, Published online: 09 Jul 2009

Figures & data

Table I.  The effect of hyperthermia with dextran magnetic fluid on grafted tumor growth.

Figure 1. The temperature curve examined by fiber optic detection: (A) intratumoral temperature; (B) rectal temperature; (a) injecting with magnetic fluid and exposed to magnetic field; (b) injecting with physiological saline and exposed to magnetic field.
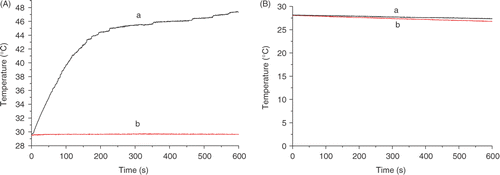
Figure 1. The temperature curve examined by fiber optic detection: (A) intratumoral temperature; (B) rectal temperature; (a) injecting with magnetic fluid and exposed to magnetic field; (b) injecting with physiological saline and exposed to magnetic field.

Figure 2. The tumor tissues stained by hematoxylin-eosin (HE). (A) 1 h after injecting with physiological saline; (B) 1 h after injecting with magnetic fluid; (C) 1 h after injecting with physiological saline and exposed to magnetic field; (D) 1 h after injecting with magnetic fluid and exposed to magnetic field; (E) 48 h after injecting with physiological saline and exposed to magnetic field; (F) 48 h after injecting with magnetic fluid and exposed to magnetic field. (The black points in B, D and F were the magnetic fluid. The scale bars represent 50 µm. A little necrosis was shown near magnetic fluid in D. Compared with A, B, C, D and E, more nucleus disaggregation and cell broken were shown around magnetic fluid in F. The necrosis in E is near the center of the tissue, however, the necrosis in f is distributed around magnetic fluid.)
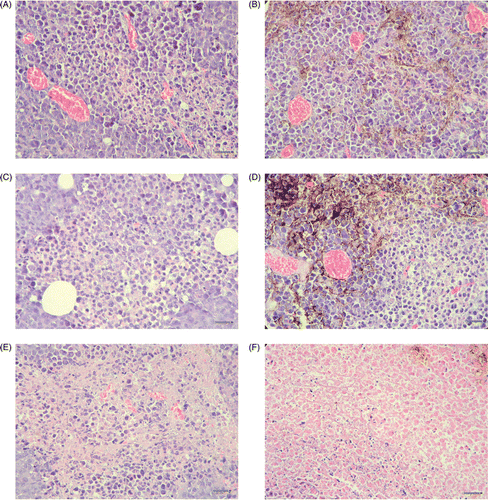
Figure 2. The tumor tissues stained by hematoxylin-eosin (HE). (A) 1 h after injecting with physiological saline; (B) 1 h after injecting with magnetic fluid; (C) 1 h after injecting with physiological saline and exposed to magnetic field; (D) 1 h after injecting with magnetic fluid and exposed to magnetic field; (E) 48 h after injecting with physiological saline and exposed to magnetic field; (F) 48 h after injecting with magnetic fluid and exposed to magnetic field. (The black points in B, D and F were the magnetic fluid. The scale bars represent 50 µm. A little necrosis was shown near magnetic fluid in D. Compared with A, B, C, D and E, more nucleus disaggregation and cell broken were shown around magnetic fluid in F. The necrosis in E is near the center of the tissue, however, the necrosis in f is distributed around magnetic fluid.)

Figure 3. The vascular endothelial growth factor (VEGF) expression of tumor tissues at 24 h after treating with magnetic field stained by immunohistochemical method. (A) injected with physiological saline; (B) injected with magnetic fluid. (The scale bars represent 50 µm. VEGF was distributing in cytoplasm and intercellular substance. The intensity in B seemed higher than in A.)

Figure 3. The vascular endothelial growth factor (VEGF) expression of tumor tissues at 24 h after treating with magnetic field stained by immunohistochemical method. (A) injected with physiological saline; (B) injected with magnetic fluid. (The scale bars represent 50 µm. VEGF was distributing in cytoplasm and intercellular substance. The intensity in B seemed higher than in A.)

Figure 4. The vascular endothelial growth factor (VEGF) expression in tumor tissues detected by flow cytometry assay (mean ± SD).
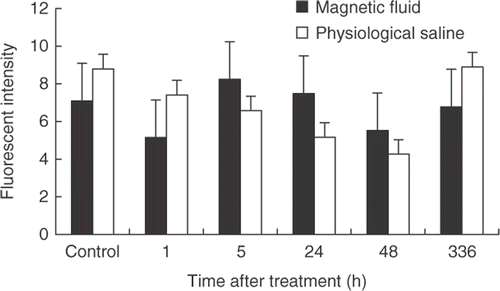
Figure 4. The vascular endothelial growth factor (VEGF) expression in tumor tissues detected by flow cytometry assay (mean ± SD).

Figure 5. In situ apoptosis detection of tumor tissues at 48 h after treating with magnetic field. (A) injected with physiological saline; (B) injected with dextran magnetic fluid. The scale bars represent 50 µm.

Figure 5. In situ apoptosis detection of tumor tissues at 48 h after treating with magnetic field. (A) injected with physiological saline; (B) injected with dextran magnetic fluid. The scale bars represent 50 µm.

Figure 6. The percentage of apoptotic cell in tumor tissues analyzed by flow cytometry assay (mean ± SD).
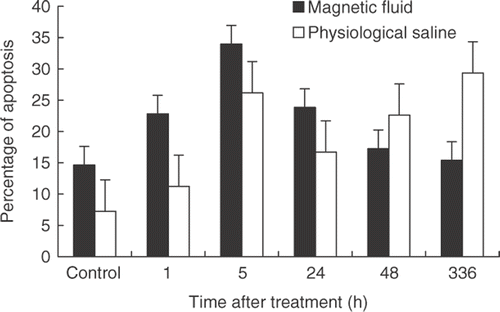
Figure 6. The percentage of apoptotic cell in tumor tissues analyzed by flow cytometry assay (mean ± SD).

Reprints and Corporate Permissions

Please note: Selecting permissions does not provide access to the full text of the article, please see our help page How do I view content?

To request a reprint or corporate permissions for this article, please click on the relevant link below:

Academic Permissions

Please note: Selecting permissions does not provide access to the full text of the article, please see our help page How do I view content?

Obtain permissions instantly via Rightslink by clicking on the button below:

If you are unable to obtain permissions via Rightslink, please complete and submit this Permissions form. For more information, please visit our Permissions help page.