606
Views
29
CrossRef citations to date
0
Altmetric
Original

The heat-induced γ-H2AX response does not play a role in hyperthermic cell killing

&
Pages 199-209 | Received 17 Jun 2008, Accepted 17 Nov 2008, Published online: 09 Jul 2009

Figures & data

Figure 1. The effect of thermotolerance on the initial magnitude of the heat-induced γ-H2AX response. Untreated HA-1 cells (▪), HA-1 cells heated at 43°C for 30 min and allowed to recover at 37°C for 12 h (•) and HA-1 cells treated with 100 μM sodium arsenite for 1 h and allowed recover at 37°C for 6 h (▴) were heated for increasing times at 43°C, processed for immediately for immunofluorescence, and the number of γ-H2AX positive cells determined as described under Materials and methods.
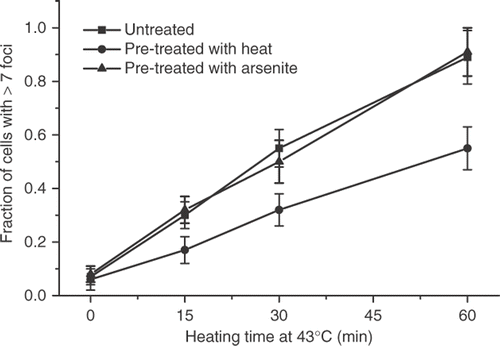
Figure 1. The effect of thermotolerance on the initial magnitude of the heat-induced γ-H2AX response. Untreated HA-1 cells (▪), HA-1 cells heated at 43°C for 30 min and allowed to recover at 37°C for 12 h (•) and HA-1 cells treated with 100 μM sodium arsenite for 1 h and allowed recover at 37°C for 6 h (▴) were heated for increasing times at 43°C, processed for immediately for immunofluorescence, and the number of γ-H2AX positive cells determined as described under Materials and methods.

Figure 2. Heat induces the formation of γ-H2AX-containing foci in HA-1 cells. Untreated cells (A) and cells heated at 43°C for 60 min (B) were fixed and stained with an antibody against γ-H2AX described under Materials and methods.
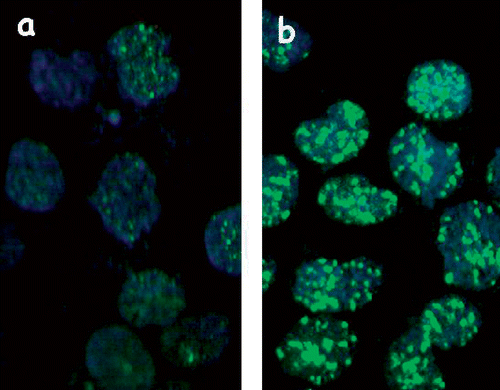
Figure 2. Heat induces the formation of γ-H2AX-containing foci in HA-1 cells. Untreated cells (A) and cells heated at 43°C for 60 min (B) were fixed and stained with an antibody against γ-H2AX described under Materials and methods.

Figure 3. The decay of the attenuation of the γ-H2AX response in thermotolerant HA-1 cells. Control cells (▪) and cells heated at 43°C for 30 min allowed to recover for 12 h (•) were heated at 43°C for 60 min at various times post treatment and the fraction of cells positive for γ-H2AX foci cells was determined.
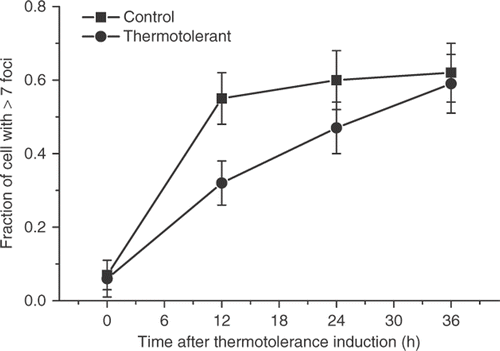
Figure 3. The decay of the attenuation of the γ-H2AX response in thermotolerant HA-1 cells. Control cells (▪) and cells heated at 43°C for 30 min allowed to recover for 12 h (•) were heated at 43°C for 60 min at various times post treatment and the fraction of cells positive for γ-H2AX foci cells was determined.

Figure 4. Attenuation of the γ-H2AX response in cells recovering from a thermotolerance induction protocol in the absence or presence of cycloheximide in HA-1 cells. The fraction of cells positive for γ-H2AX foci was determined in control cells (▪), cells heated at 43°C for 30 min and allowed to recover for 12 h (•) and cells recovering from a 43°C heating for 30 min in the presence of 100 μM cycloheximide for 6 h (▴).
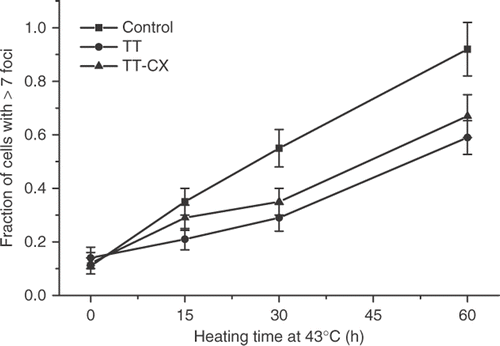
Figure 4. Attenuation of the γ-H2AX response in cells recovering from a thermotolerance induction protocol in the absence or presence of cycloheximide in HA-1 cells. The fraction of cells positive for γ-H2AX foci was determined in control cells (▪), cells heated at 43°C for 30 min and allowed to recover for 12 h (•) and cells recovering from a 43°C heating for 30 min in the presence of 100 μM cycloheximide for 6 h (▴).

Figure 5. Resolution of γ-H2AX foci in control and thermotolerant HA-1 cells. Control (▪) heat-induced thermotolerant (•) and arsenite-induced thermotolerant (▴) HA-1 cells were heated at 43°C for 60 min at various times after the original thermotolerance inducing treatment and the fraction of γ-H2AX foci positive cells was determined.
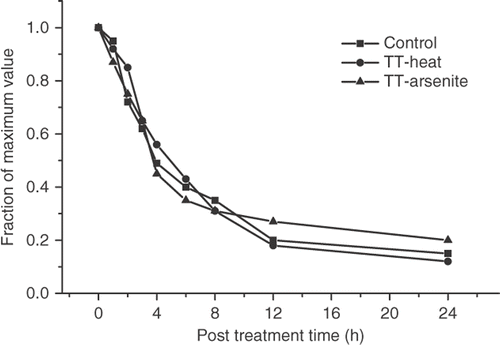
Figure 5. Resolution of γ-H2AX foci in control and thermotolerant HA-1 cells. Control (▪) heat-induced thermotolerant (•) and arsenite-induced thermotolerant (▴) HA-1 cells were heated at 43°C for 60 min at various times after the original thermotolerance inducing treatment and the fraction of γ-H2AX foci positive cells was determined.

Figure 6. Comparison of the heat-induced γ-H2AX response in wild type HA-1 cells and the HR-1 permanently heat resistant cells derived from them. (A) HA-1 (▪) and HR-1 cells (•) were heated for various lengths of time at 43°C and the fraction of γ-H2AX foci positive cells was determined. (B) Resolution of the heat-induced γ-H2AX foci in HA-1 (▪) and HR-1 cells (•). Cells were heated at 43°C for 60 min and the fraction of γ-H2AX foci positive cells was determined at various times post treatment.
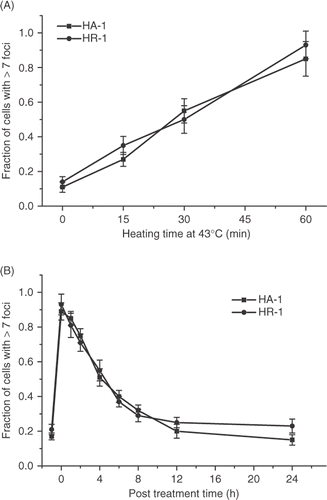
Figure 6. Comparison of the heat-induced γ-H2AX response in wild type HA-1 cells and the HR-1 permanently heat resistant cells derived from them. (A) HA-1 (▪) and HR-1 cells (•) were heated for various lengths of time at 43°C and the fraction of γ-H2AX foci positive cells was determined. (B) Resolution of the heat-induced γ-H2AX foci in HA-1 (▪) and HR-1 cells (•). Cells were heated at 43°C for 60 min and the fraction of γ-H2AX foci positive cells was determined at various times post treatment.

Figure 7. Comparison of the heat-induced γ-H2AX response in wild type O23 cells and two heat resistant cell lines derived from them that overexpress human hsp 27. (A) Control O23 cells (▪) and heat resistant clones 1.2 (•) and 2.2 (▴) were all heated at 43°C for various lengths of time and the fraction of γ-H2AX foci positive cells was determined. (B) Control O23 cells (▪) and clones 1.2 (•) and 2.2 (▴) were heated at 43°C for 60 min and the fraction of cells positive for γ-H2AX foci was determined at various times post treatment.
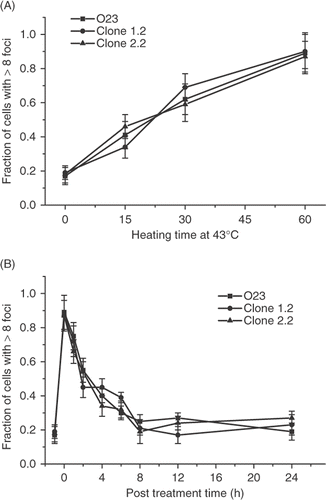
Figure 7. Comparison of the heat-induced γ-H2AX response in wild type O23 cells and two heat resistant cell lines derived from them that overexpress human hsp 27. (A) Control O23 cells (▪) and heat resistant clones 1.2 (•) and 2.2 (▴) were all heated at 43°C for various lengths of time and the fraction of γ-H2AX foci positive cells was determined. (B) Control O23 cells (▪) and clones 1.2 (•) and 2.2 (▴) were heated at 43°C for 60 min and the fraction of cells positive for γ-H2AX foci was determined at various times post treatment.

Figure 8. Comparison of the heat-induced γ-H2AX response in wild type 10B-2 CHO cells and the heat sensitive HS-36 cell line derived from them. (A) Wild type 10B-2 (▪) and heat sensitive HS-36 (•) cells were heated at 43°C for various lengths of time and the fraction of γ-H2AX positive cells was determined. (B) 10B-2 cells (▪) and HS-36 cells (•) were heated at 43°C for 60 min and the fraction of γ-H2AX foci positive cells was determined at various times post treatment.
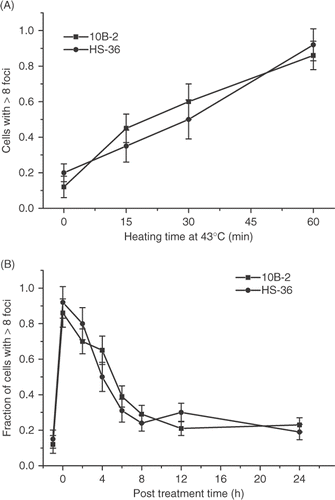
Figure 8. Comparison of the heat-induced γ-H2AX response in wild type 10B-2 CHO cells and the heat sensitive HS-36 cell line derived from them. (A) Wild type 10B-2 (▪) and heat sensitive HS-36 (•) cells were heated at 43°C for various lengths of time and the fraction of γ-H2AX positive cells was determined. (B) 10B-2 cells (▪) and HS-36 cells (•) were heated at 43°C for 60 min and the fraction of γ-H2AX foci positive cells was determined at various times post treatment.

Figure 9. The effect of glycerol on the heat-induced γ-H2AX response in HA-1 cells. Control cells (▪) and cell treated with 1 M glycerol for 30 min (•) were heated at 43°C for various lengths of time and the fraction of cells positive for γ-H2AX foci was determined.
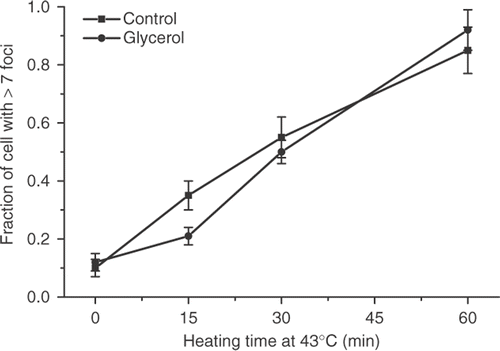
Figure 9. The effect of glycerol on the heat-induced γ-H2AX response in HA-1 cells. Control cells (▪) and cell treated with 1 M glycerol for 30 min (•) were heated at 43°C for various lengths of time and the fraction of cells positive for γ-H2AX foci was determined.
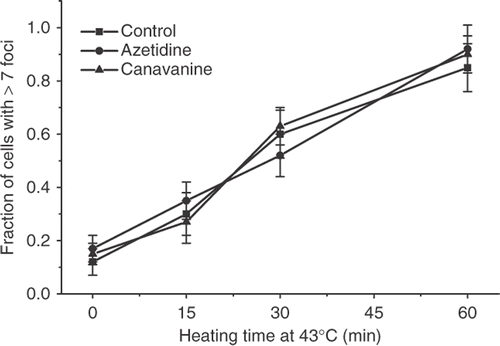
Figure 10. The effect of treatment with amino acid analogs on the heat-induced γ-H2AX response in HA-1 cells. Control HA-1 cells (▪), and HA-1 cells treated for 8 hours with 2.5 mM azetidine (•) or HA-1 cells treated for 8 hours with 1 mM canavanine (▴) were exposed to 43°C for various lengths of time and the fraction of cells positive for γ-H2AX foci was determined.

Figure 10. The effect of treatment with amino acid analogs on the heat-induced γ-H2AX response in HA-1 cells. Control HA-1 cells (▪), and HA-1 cells treated for 8 hours with 2.5 mM azetidine (•) or HA-1 cells treated for 8 hours with 1 mM canavanine (▴) were exposed to 43°C for various lengths of time and the fraction of cells positive for γ-H2AX foci was determined.

Figure 11. Comparison of the γ-H2AX response of wild type HA-1 cell and the OC-14 oxidative stress resistant cells derived from them. (A) HA-1 cells (▪) and OC-14 cells (•) were heated at 43°C for various lengths of time and the fraction of positive cells for γ-H2AX foci was determined. (B) HA-1 (▪) and OC-14 (•) cells were heated at 43°C for 60 min and the fraction of cells positive for γ-H2AX foci was determined at various times post treatment.
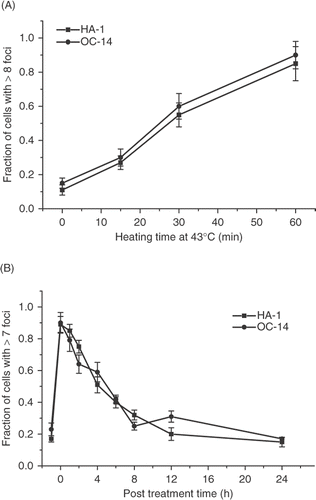
Figure 11. Comparison of the γ-H2AX response of wild type HA-1 cell and the OC-14 oxidative stress resistant cells derived from them. (A) HA-1 cells (▪) and OC-14 cells (•) were heated at 43°C for various lengths of time and the fraction of positive cells for γ-H2AX foci was determined. (B) HA-1 (▪) and OC-14 (•) cells were heated at 43°C for 60 min and the fraction of cells positive for γ-H2AX foci was determined at various times post treatment.

Figure 12. Lack of correlation between heat-induced cell killing after heating for 60 min at 43°C and the fraction of cells with >7 γ-H2AX foci immediately after heating (A) or the half-time for the resolution of the γ-H2AX foci, as indicated by the decrease in the fraction of cells with >7 γ-H2AX foci to 50% of the original value.
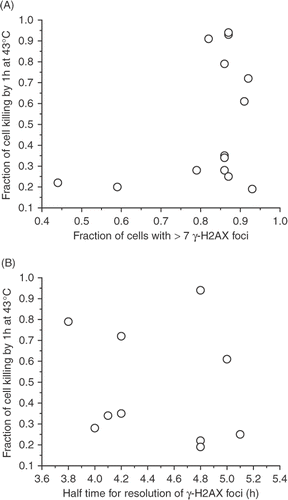
Figure 12. Lack of correlation between heat-induced cell killing after heating for 60 min at 43°C and the fraction of cells with >7 γ-H2AX foci immediately after heating (A) or the half-time for the resolution of the γ-H2AX foci, as indicated by the decrease in the fraction of cells with >7 γ-H2AX foci to 50% of the original value.

Figure 13. Comparison of the radiation and heat response of H2AX+/+ and H2AX−/− MEFs. (A) H2AX+/+ (▪) and H2AX−/− MEFs (•) were irradiated with various doses of X-rays and clonogenic survival was determined. (B) H2AX+/+ (▪) and H2AX−/−(•) MEFs were heated at 43°C for various lengths of time and clonogenic survival was determined.
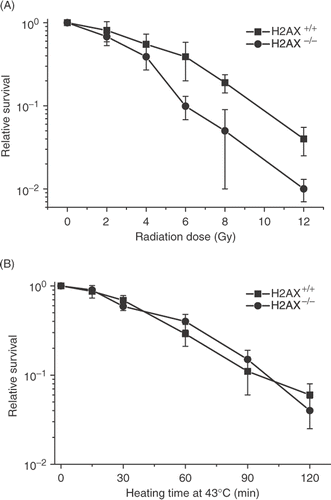
Figure 13. Comparison of the radiation and heat response of H2AX+/+ and H2AX−/− MEFs. (A) H2AX+/+ (▪) and H2AX−/− MEFs (•) were irradiated with various doses of X-rays and clonogenic survival was determined. (B) H2AX+/+ (▪) and H2AX−/−(•) MEFs were heated at 43°C for various lengths of time and clonogenic survival was determined.

Table I.  Summary of the relationship of heat sensitivity and the heat induced γ-H2AX response.

Reprints and Corporate Permissions

Please note: Selecting permissions does not provide access to the full text of the article, please see our help page How do I view content?

To request a reprint or corporate permissions for this article, please click on the relevant link below:

Academic Permissions

Please note: Selecting permissions does not provide access to the full text of the article, please see our help page How do I view content?

Obtain permissions instantly via Rightslink by clicking on the button below:

If you are unable to obtain permissions via Rightslink, please complete and submit this Permissions form. For more information, please visit our Permissions help page.