763
Views
28
CrossRef citations to date
0
Altmetric
Research Article

Local moderate magnetically induced hyperthermia using an implant formed in situ in a mouse tumor model

, , , , , , & show all
Pages 229-239 | Received 06 May 2008, Accepted 27 Dec 2008, Published online: 09 Jul 2009

Figures & data

Table I.  Summary of parameters (mean ± SD) calculated for each group of the thermometry study for 5 magnetic field strengths.

Figure 1. Thermograms representing tumor temperature as a function of time. (a), during single 20-min treatments in a 141 KHz alternating magnetic field, for magnetic field strengths of 9 mT (n = 5), 10 mT (n = 4), 10.5 mT (n = 5), 11 mT (n = 3), 12 mT (n = 5). (b), during two stepwise 25-min treatments in an 141-KHz alternating magnetic field. Magnetic field strength was 9 mT from 0 to 10 min, 10 mT from 10 to 15 min, 11 mT from 15 to 20 min, 12 mT from 20 to 25 min.
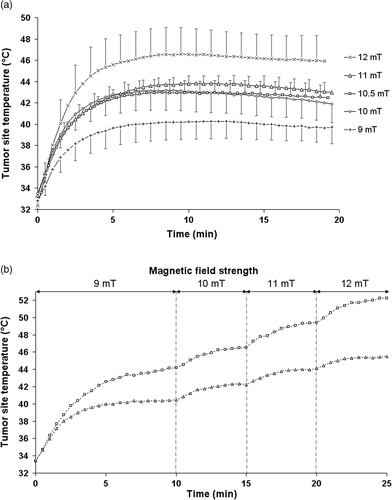
Figure 1. Thermograms representing tumor temperature as a function of time. (a), during single 20-min treatments in a 141 KHz alternating magnetic field, for magnetic field strengths of 9 mT (n = 5), 10 mT (n = 4), 10.5 mT (n = 5), 11 mT (n = 3), 12 mT (n = 5). (b), during two stepwise 25-min treatments in an 141-KHz alternating magnetic field. Magnetic field strength was 9 mT from 0 to 10 min, 10 mT from 10 to 15 min, 11 mT from 15 to 20 min, 12 mT from 20 to 25 min.

Figure 2. Microphotographs at D2 (with or without implant injection at D0 and hyperthermic treatment at D1). Panel (a) shows at left the control Co112 tumor, with non-induced necrosis (arrow) that typicaliy did not exhibit an inflammatory reaction (insert), and at right the control with the nonheated implant shown in brown. Panel (b) displays three treated tumors at low magnification in the upper row and at higher magnification in the lower row. On the left, a tumor treated with a magnetic field strength of 10 mT (MET = 39.5°C, AUC = 152.8°C1 min) leaving most of viable tumor tissue (T) without any heat-inducec1 necrosis. In the middle, a tumor treated with a magnetic field strength of 10.5 mT (MET = 44.0°C, AUC = 211.8°C1min) shows clear heat-induced necrosis (h) around the implant, but more distant tumor tissue remains viable. On the right, a tumor treated with a magnetic field strength of 12 mT (MET = 46.2°C, AUC = 284.3°C1min) illustrates heat induced necrosis (h) covering most of the tumor and effecting intense thermal damage (H) in the vicinity of implant, accompanied by an inflammatory reaction (neutrophils and macrophages, see insert). Pane! (c) illustrates the topographic association between implant and heat-induced necrosis. A small isolated extension of the implant (arrow) did not trigger heat damage, in contrast to the more voluminous main body of the implant.
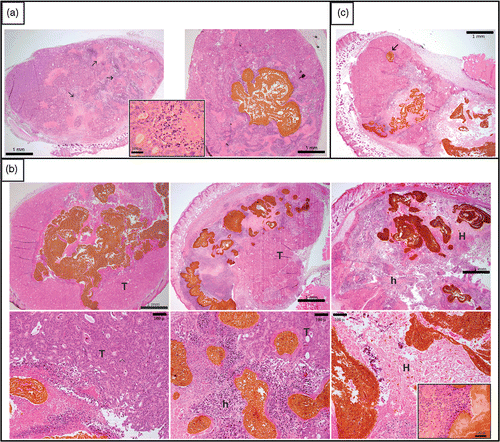
Figure 2. Microphotographs at D2 (with or without implant injection at D0 and hyperthermic treatment at D1). Panel (a) shows at left the control Co112 tumor, with non-induced necrosis (arrow) that typicaliy did not exhibit an inflammatory reaction (insert), and at right the control with the nonheated implant shown in brown. Panel (b) displays three treated tumors at low magnification in the upper row and at higher magnification in the lower row. On the left, a tumor treated with a magnetic field strength of 10 mT (MET = 39.5°C, AUC = 152.8°C1 min) leaving most of viable tumor tissue (T) without any heat-inducec1 necrosis. In the middle, a tumor treated with a magnetic field strength of 10.5 mT (MET = 44.0°C, AUC = 211.8°C1min) shows clear heat-induced necrosis (h) around the implant, but more distant tumor tissue remains viable. On the right, a tumor treated with a magnetic field strength of 12 mT (MET = 46.2°C, AUC = 284.3°C1min) illustrates heat induced necrosis (h) covering most of the tumor and effecting intense thermal damage (H) in the vicinity of implant, accompanied by an inflammatory reaction (neutrophils and macrophages, see insert). Pane! (c) illustrates the topographic association between implant and heat-induced necrosis. A small isolated extension of the implant (arrow) did not trigger heat damage, in contrast to the more voluminous main body of the implant.

Figure 3. Survival curves. Dotted line: control group (c), n = 6; dashed line: implanted control group (IC), n = 7 normal line: 10.5-mT treated group, n = 7; bold line 12-mT treated group, n = 11. Note that in the group treated with a 12-mT alternating magnetic field, 5 of 11 mice survived 12 months after treatment without tumor relapse.
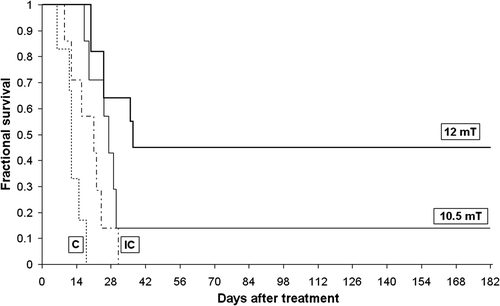
Figure 3. Survival curves. Dotted line: control group (c), n = 6; dashed line: implanted control group (IC), n = 7 normal line: 10.5-mT treated group, n = 7; bold line 12-mT treated group, n = 11. Note that in the group treated with a 12-mT alternating magnetic field, 5 of 11 mice survived 12 months after treatment without tumor relapse.

Figure 4. Implant imaging. (a), MRI imaging of a swiss nude mouse bearing a subcutaneous tumor injected with 0.25 ml of the implant formulation, with a T1 weighted sequence. The tumor zone is enclosed in the dotted white circle, highlighting the susceptibility artifact caused by SPION entrapped in the implant. (b), Micro-computerized tomography of a swiss nude mouse bearing a subcutaneous tumor punctured with 0.25 ml of the implant formulation. In the transversal, section, we can precisely localize the implant (in white) and the tumor that is enclosed within the dotted black circle. The SPIONs entrapped in the implant allowed for X-ray absorption with an absorption density close to that of bone (see, for instance, the spinal vertebrae and iliac wing highlighted by the dotted white circle). Note that the window is adjusted for bone density without further soft tissue contrast refinements or the use of contrast agent.
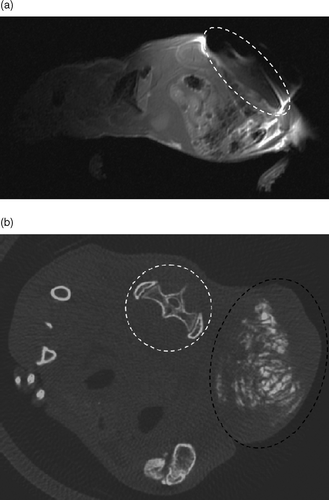
Figure 4. Implant imaging. (a), MRI imaging of a swiss nude mouse bearing a subcutaneous tumor injected with 0.25 ml of the implant formulation, with a T1 weighted sequence. The tumor zone is enclosed in the dotted white circle, highlighting the susceptibility artifact caused by SPION entrapped in the implant. (b), Micro-computerized tomography of a swiss nude mouse bearing a subcutaneous tumor punctured with 0.25 ml of the implant formulation. In the transversal, section, we can precisely localize the implant (in white) and the tumor that is enclosed within the dotted black circle. The SPIONs entrapped in the implant allowed for X-ray absorption with an absorption density close to that of bone (see, for instance, the spinal vertebrae and iliac wing highlighted by the dotted white circle). Note that the window is adjusted for bone density without further soft tissue contrast refinements or the use of contrast agent.

Reprints and Corporate Permissions

Please note: Selecting permissions does not provide access to the full text of the article, please see our help page How do I view content?

To request a reprint or corporate permissions for this article, please click on the relevant link below:

Academic Permissions

Please note: Selecting permissions does not provide access to the full text of the article, please see our help page How do I view content?

Obtain permissions instantly via Rightslink by clicking on the button below:

If you are unable to obtain permissions via Rightslink, please complete and submit this Permissions form. For more information, please visit our Permissions help page.